4. The Big Macro Variables That Move Your Investments: A Panorama
· 21 min read
First Friday of the month. It is 2:30 p.m. in Paris, 8:30 a.m. in Washington, and in a few seconds the most awaited number on the financial planet drops: the monthly report on American employment. That day, it is excellent — far more hiring than expected, an unemployment rate that recedes. The economy is doing wonderfully, and the common-sense saver expects to see the markets salute the news. Yet the opposite happens: stock indexes plunge, bonds fall at the same moment, and the evening commentators sum up the day with a formula that seems to defy logic — good news is bad news.
Nothing is broken, and the market has not gone mad. It has simply unspooled, in a few seconds, a chain of reasoning: an economy hiring at that pace is an economy running hot; an economy running hot pushes wages up, and therefore prices; runaway prices will force the central bank to keep interest rates high for longer; and higher rates, as we glimpsed in the very first chapter, weigh on the price of almost every asset. The vigor of the real economy was judged less important than what it implies for the rent of money. That is the kind of gymnastics, disconcerting at first, that this chapter means to make natural.
For this scene is nothing exceptional — it replayed almost every month through 2022 and 2023. To understand it, there is no need to swallow whole textbooks: the essentials of what moves a portfolio can be told with a handful of magnitudes. Growth, inflation, interest rates, employment, the central bank holding the thermostat, and, in the background, exchange rates and energy: six families of variables, no more. Each will have, later in this journey, its dedicated chapters — where we will take the mechanisms apart piece by piece. Today we do something else: we gain altitude and draw the map. Who are these variables, through which channel does each one touch your investments, and how do they hold one another together?
To read this map, a single grid suffices — the one the first chapter laid down. The price of every asset is a fraction: on the numerator, expected future income — profits, dividends, interest, rents —; on the denominator, the discount rate that converts those distant promises into today's value. Everything that follows can be summed up this way: each macroeconomic variable acts on the top floor, on the bottom floor, or on both at once. Keep that fraction in mind; it is the key to the whole panorama.
The dashboard: six dials for one economy
The previous chapter showed it: macroeconomics looks at the economy as a whole, through aggregates that condense the activity of millions of agents into a few numbers. One must still choose which to watch. Statistical institutes publish thousands of series — industrial production, retail sales, building permits, household confidence… The investor who tried to follow them all would drown; the one who follows none is flying blind. Between the two lies the pilot's gesture: a reduced dashboard, a few essential dials, swept regularly and read together.
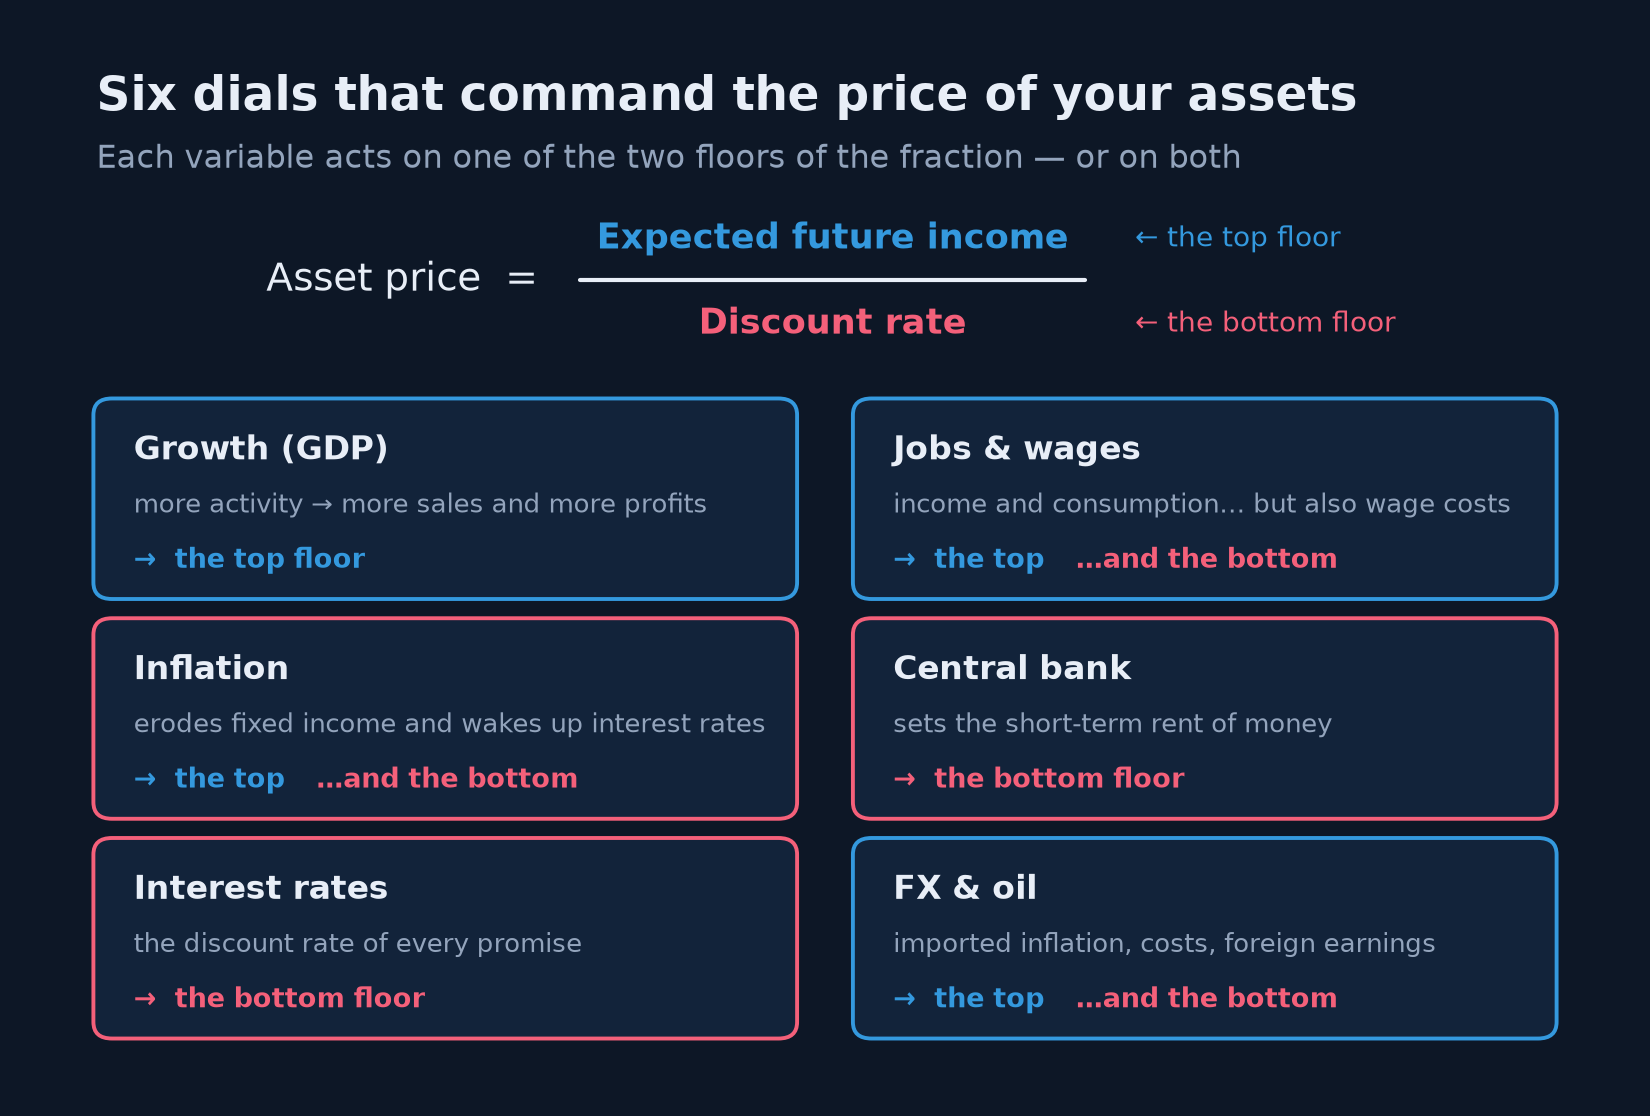
The six dials of the panorama, and the floor of the fraction each one acts on. Growth feeds the top; rates and the central bank command the bottom; employment, inflation and the outside world touch both at once — which is precisely what makes them delicate to read.
These six dials are not independent instruments set side by side: they are the organs of a single body, tied together by loops we will learn to follow. But before looking at the system, each organ must be introduced. Let us take them one by one.
Growth: the engine of the fraction's top floor
Everything begins with the simplest question: is the economy producing more or less than yesterday? The magnitude that answers it is gross domestic product (GDP) — the sum of everything a country produces in a year — and its variation is called growth. The next module is devoted to it entirely; let us keep here to the channel that leads to your investments, for it is direct. A growing economy means more customers in the shops, more orders in the books, more revenue — and so, at the end of the chain, more profits. And a stock is nothing other than a claim on a company's future profits: growth feeds the top floor of the fraction. Over long periods, the march of equity markets follows — imperfectly, with sometimes spectacular detours — that of profits, and profits follow that of activity.
Growth, moreover, irrigates far more than stocks. It is the income it generates that repays loans — hence the health of banks and corporate bonds — and the taxes it yields that make public debts sustainable. It also commands employment: the statistical relation between growth and unemployment, put into numbers by the economist Arthur Okun in the 1960s, is one of the discipline's most robust — when activity accelerates durably, unemployment eventually recedes, and conversely. It is in this sense that growth is the master dial of the real economy: almost all the others reflect it with a lag or a lead.
One warning, though, which the previous chapter has prepared: markets live on expectations, and growth already forecast is already in prices. It is not the level of growth that moves prices on a given day, it is the gap between what comes out and what was expected — we will return to this, for the rule holds for every dial on the dashboard.
Inflation: the silent thief that wakes everything else
Second dial: inflation, the general and lasting rise of prices. Its measurement — which prices, which basket, which limits — will occupy an entire module; let us retain here its double face, for it acts on your investments through two quite distinct channels.
The first is erosion. Inflation nibbles, silently, at every income fixed in advance: a bond's coupon, a contract's rent, a savings account's interest, a pension annuity. At 5% inflation, an investment yielding 3% impoverishes its holder — he gains euros and loses purchasing power. This is the distinction, formalized by the economist Irving Fisher, between the nominal return — the one on display — and the real return — the one that remains once inflation is deducted. It sounds academic; it is existential for the saver, and we will devote long developments to it.
The second channel is more brutal: inflation is the variable the central bank has sworn to tame. As long as it sleeps around its target — about 2% in most large economies —, it oils the gears without drawing attention. But when it escapes, it triggers the riposte of interest rates, and then the whole fraction trembles from below. The years 2021-2022 reminded a generation of investors who had never known it: American inflation peaking near 9% year on year in the summer of 2022 — unseen in four decades —, more than 10% in the euro area that autumn, and, in response, the most violent climb in rates since the 1980s. That year, stocks and bonds fell together: the classic refuge did not protect, precisely because the common enemy of both asset classes was inflation. Moderate and stable, inflation is a discreet companion; high and unstable, it is a poison for almost everything you own.
Interest rates: the universal gravity of asset prices
Third dial, perhaps the most powerful: interest rates — the price of time, the rent of money. This is the bottom floor of the fraction, the rate at which markets discount every future promise. Warren Buffett gave the image that stuck, in a 1999 piece: interest rates act on financial valuations the way gravity acts on matter — the higher they are, the stronger the force pulling every price down.
The mechanics are implacable for bonds: their payments being fixed in advance, any rise in prevailing rates makes the old ones less attractive, and their price falls — an inverse relation we will dismantle in detail when the time comes. For stocks, the effect is subtler but just as real: the more distant a company's expected profits — think of growth stocks, whose earnings are mostly promised for ten or twenty years out —, the more sensitive their present value is to the rate that discounts them. That is the lesson of 2022: when rates took off, the finest growth stories on the exchange were the most punished, not because their business was going badly, but because gravity had changed.
Rates play one last role that is often forgotten: that of competitor. Every asset on the planet is in permanent competition with the risk-free investment. When it yields 5%, one needs solid reasons to take the risk of stocks; when it yields nothing, everything that offers a return looks irresistible. The level of rates thus sets the bar every other investment must clear. One final word: there is not one rate but a whole range, from the overnight rate to thirty-year rates, and that range — the yield curve — tells its own story; it will have its chapters.
The central bank: the hand on the thermostat
Who sets the rates? For short maturities, an institution this journey will meet again and again: the central bank — the Federal Reserve (Fed) in the United States, the European Central Bank (ECB) in the euro area. Its first mission, almost everywhere, is price stability, understood as inflation of about 2%; the Fed explicitly adds full employment. Its main lever: the policy rate, the overnight rent of money, whose variations propagate step by step through the whole edifice of rates, and then, through the fraction, to every asset price.
Its reaction logic is simple to state: when the economy runs hot and inflation threatens, it raises rates to cool demand; when activity collapses, it lowers them to revive it. From this simple rule flows the markets' obsession with its slightest gestures — every meeting, every press conference, every adjective in a statement is dissected, for whoever anticipates the thermostat anticipates gravity. This influence is not an impression: Ben Bernanke and Kenneth Kuttner measured that an unanticipated quarter-point cut in the American policy rate is accompanied, the same day, by a rise of about 1% in the broad stock indexes. And that is why one of Wall Street's most famous adages, popularized by the analyst Martin Zweig in the 1980s, commands "don't fight the Fed": swimming against the current of monetary conditions is the surest way to exhaust oneself.
Nothing illustrates this inflation-central bank couple better than the episode this series will follow as its running thread: the years 2020-2025.
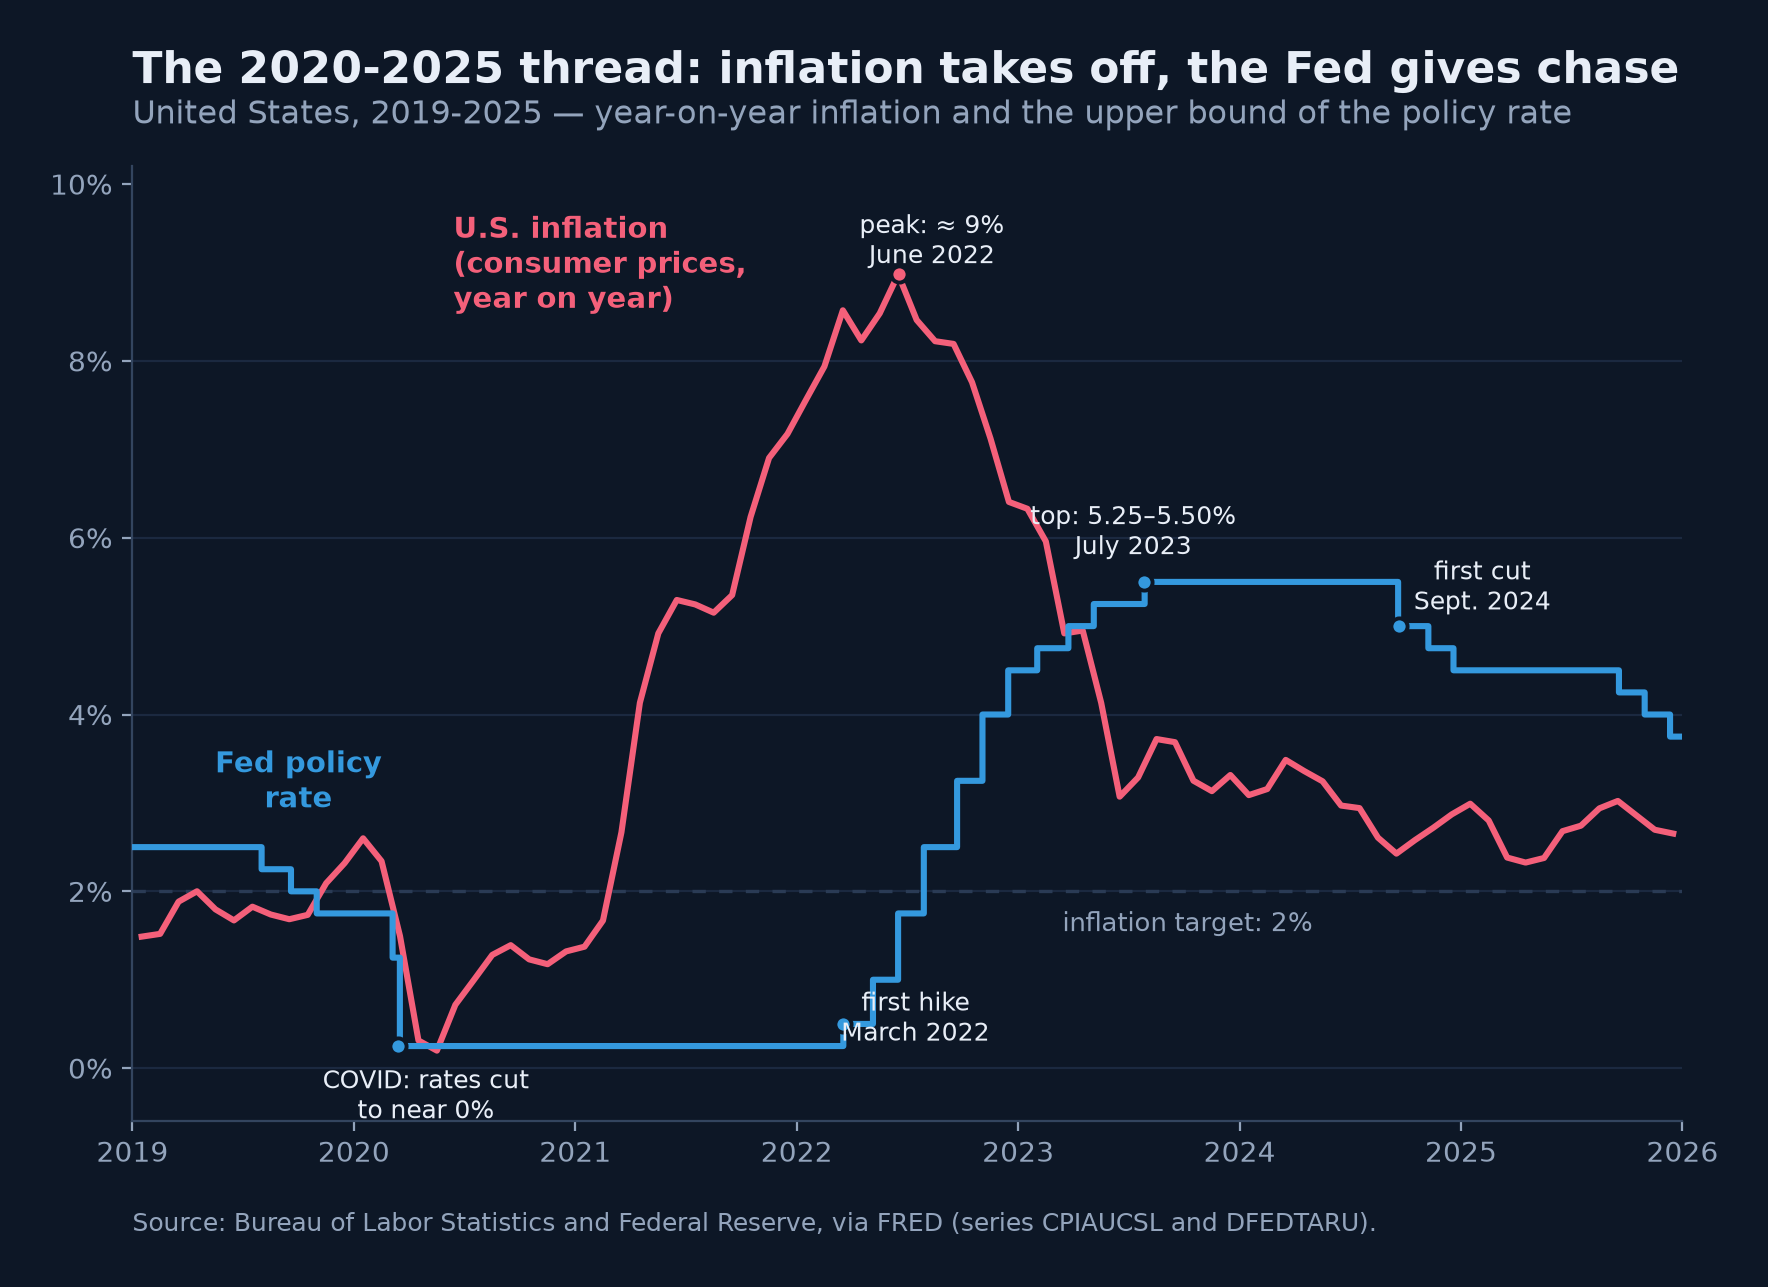
The running thread of this journey in one image: the pandemic sends rates plunging near zero; inflation takes off in 2021-2022 to nearly 9%; the Fed gives chase with the fastest climb in rates since the 1980s, waits more than a year at the top, then begins the descent in September 2024. Every step of the blue staircase shook the prices of every asset on the planet — this is the bottom dial of the fraction, piloted live.
One guardrail before going further: this episode is a textbook case, not a universal law. Every cycle has its own physiognomy, and one of the investor's classic errors is to generalize the last episode lived through. The running thread will serve us as concrete anchoring, never as a template.
Employment: the dial markets scrutinize every month
Let us now return to the opening scene, for we now have every element needed to untie it. Why so much agitation around an employment report? First because it is frequent, broad and fresh: every month, generally on the first Friday, the United States publishes in one go the jobs created, the unemployment rate and the progression of wages — a monthly X-ray of the world's largest economy, available well before the quarterly GDP figures. Next and above all because employment is wired into both floors of the fraction at once.
On the numerator side, employment is household income; and the consumption of those households represents about two thirds of the American economy. More jobs means more wages paid, more spending, more sales, more profits: the top floor breathes. But on the denominator side, an overly tight labor market — too few candidates for too many openings — pushes wages up; and the relation between labor-market tightness and wage growth, documented as early as 1958 by the economist A. W. Phillips, is one of the links through which an overheating economy manufactures inflation. Runaway wages mean a central bank that tightens — and a bottom floor that takes its revenge.
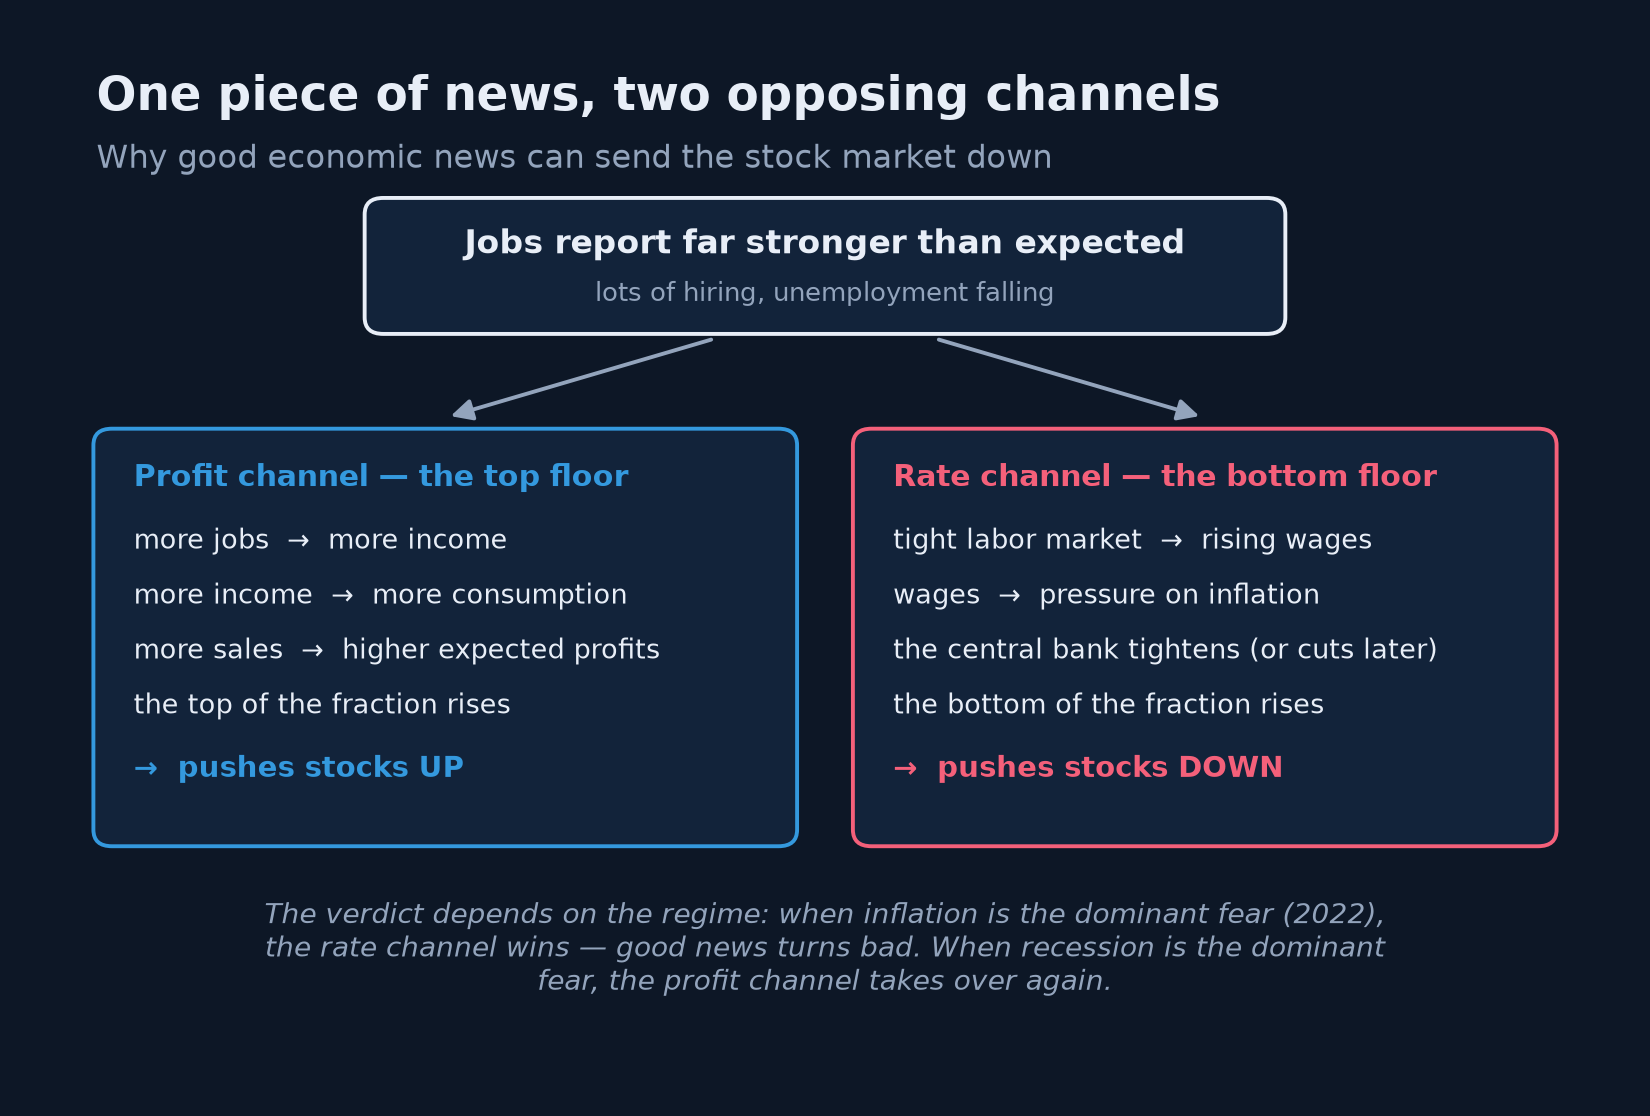
The same news travels two channels of opposite sign: it swells expected profits from the top and threatens to harden rates from the bottom. The day's verdict depends on the dominant fear of the moment — which is why there is no single answer to the question "is a good statistic good for the stock market?".
Which of the two forces wins? It depends on the regime — that is, on the dominant fear of the moment. Three researchers, John Boyd, Jian Hu and Ravi Jagannathan, established the result in a study that became famous: in expansions, when the number-one fear is inflation and the central bank's riposte, a surprise rise in unemployment on average makes stocks go up — bad news is good news, for it pushes monetary tightening further away; in recessions, when the number-one fear is the collapse of profits, the same news sends them down. There is the opening paragraph's riddle solved: in 2022-2023, inflation was the markets' terror, the rate channel crushed the profit channel, and a too-vigorous jobs report was received as a threat. The market was not irrational; it was weighing two channels, and the second was the heavier.
The outside world: exchange rates and oil
No economy is an island, and two dials connect your portfolio to the rest of the world. The first is the exchange rate — the price of one currency expressed in another. It acts through at least three channels: a weakening currency makes imports dearer and manufactures imported inflation; it boosts, symmetrically, the competitiveness of exporters; and it modulates the value of everything you hold abroad. This last point deserves underlining for the European saver: holding American stocks is stacking two bets — the one on the companies, and the one, often ignored, on the dollar. A year in which Wall Street rises 10% while the dollar loses 10% against the euro is a blank year for an unhedged portfolio. The very particular role of the dollar — the currency of the world's trade and debt — will occupy an entire module of this journey.
The second outside dial is the price of energy, oil first among them. It is at once a diffuse production cost — transport, plastics, fertilizer, electricity — and a direct component of the household basket, at the pump as on the heating bill. That is why the great oil shocks combine both evils: they push inflation up and activity down, since money gone into gasoline is no longer spent elsewhere. The 1970s were the historical demonstration, and the energy flare-up that followed the invasion of Ukraine in 2022 gave a replica — one of the very fuels, in fact, of our running thread's inflation peak.
No dial can be read alone
Presenting the variables one by one was necessary; yet it would betray them to stop there, and the previous chapter taught us why. In general equilibrium, everything is the rest of everything: growth creates jobs, jobs feed wages, wages feed inflation, inflation dictates the central bank's conduct, the central bank sets rates — and rates brake or stimulate growth, which creates or destroys jobs. The loop is closed, and it turns without end. The dashboard is not a collection of independent dials: it is a single mechanism seen from six angles.
From this flows the whole chapter's lesson of method: an isolated dial never delivers a verdict. "Growth is accelerating" is neither good nor bad news in itself — everything depends on what inflation is doing at the same moment, hence on what the central bank will do. It is the combinations that define the market climate: solid growth and well-behaved inflation is the most breathable air a portfolio can hope for; weak growth and high inflation — the regime known as stagflation — is the least, for it spares neither stocks nor bonds. We will devote, far along this journey, an entire module to these macroeconomic regimes and to what they do to the major asset classes. For now, let us keep the reflex: never one number alone, always the whole panel.
The surprise, not the level
One last piece remains, without which the panorama would mislead. Since markets live on expectations, everything foreseeable is already in prices: expected growth, expected inflation, expected rate cuts. What moves prices on an announcement day is therefore not the number — it is the gap between the number and the consensus, the average of economists' forecasts, published and known to all before each release.
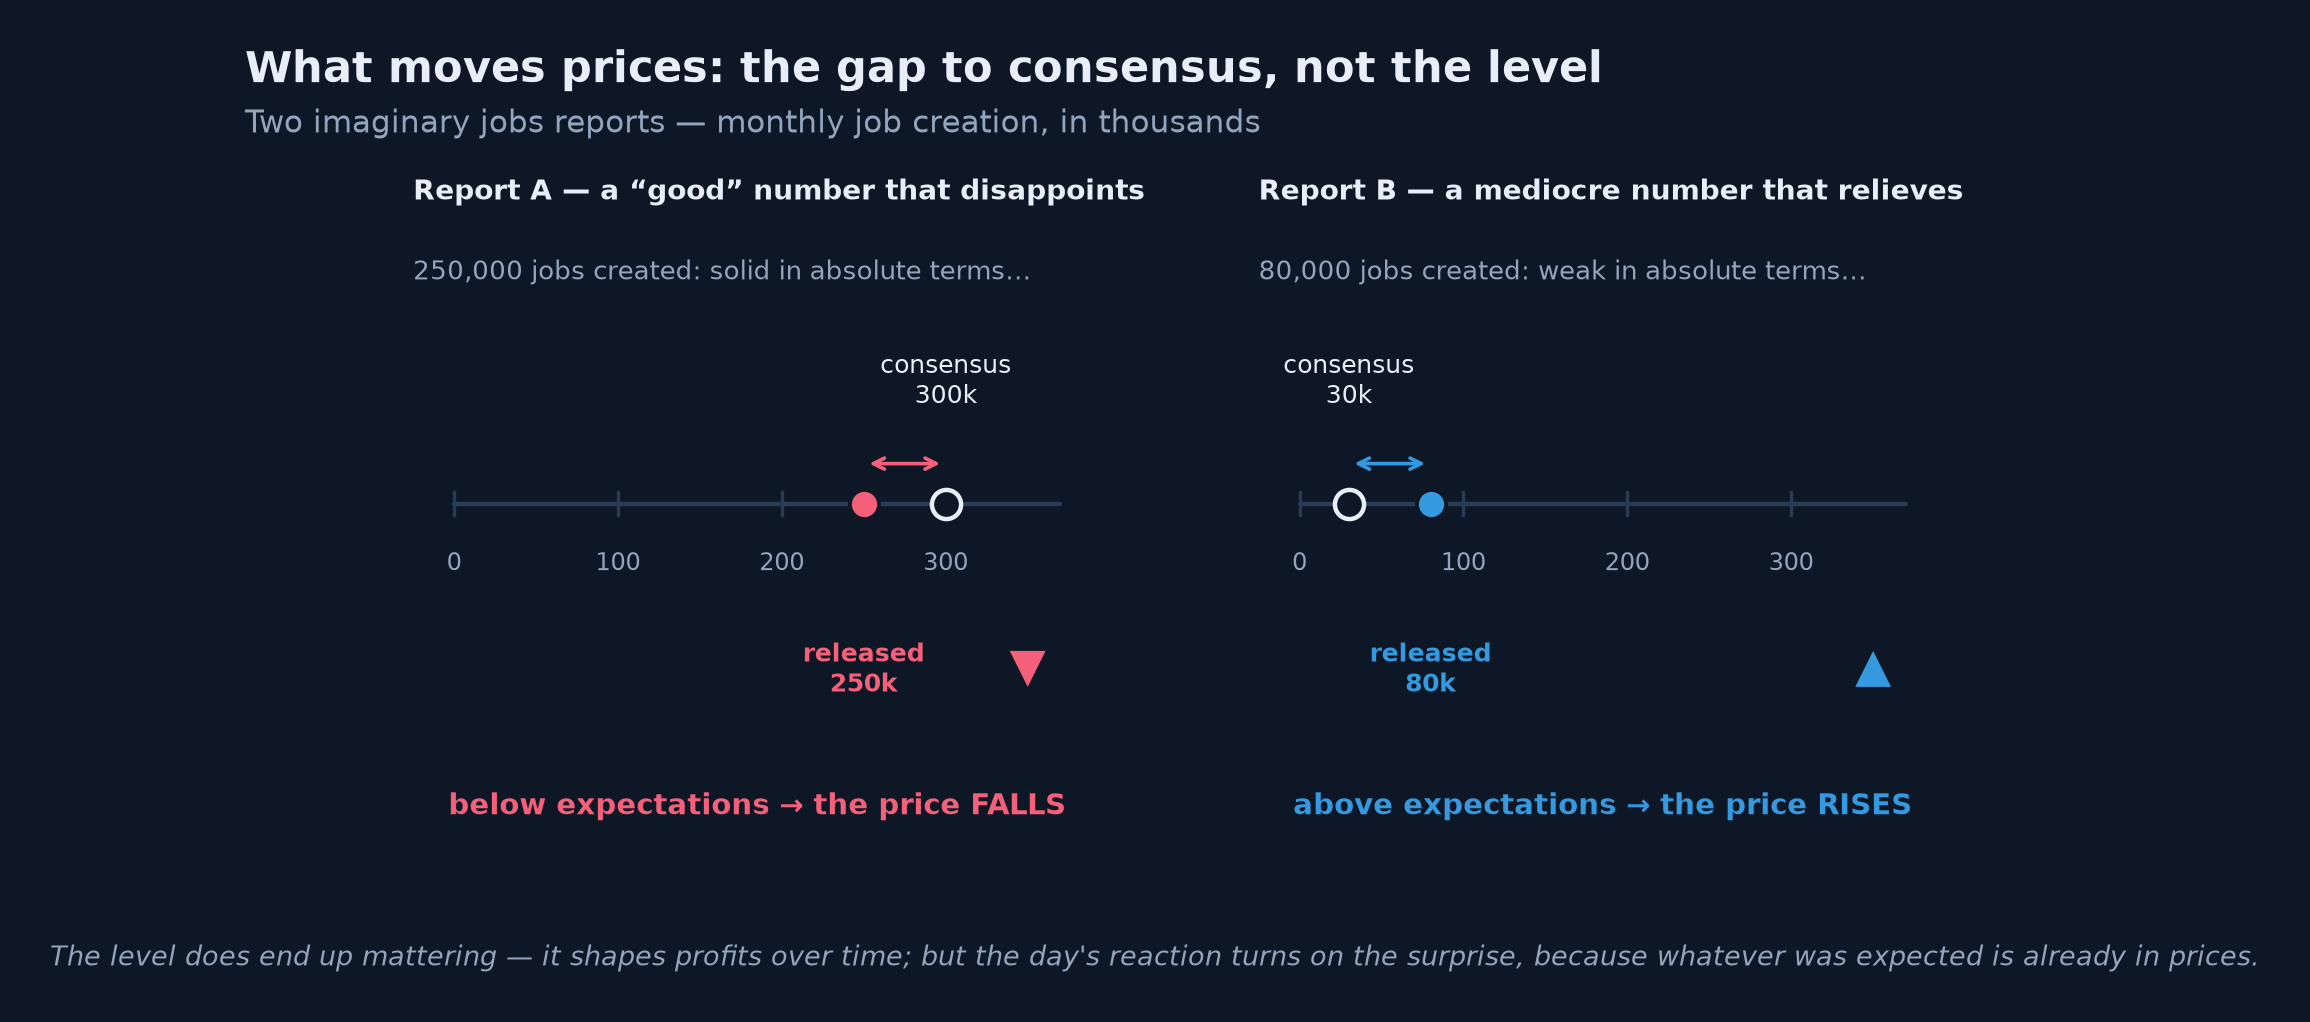
A "good" number below expectations disappoints and sends prices down; a mediocre number above expectations relieves and sends them up. The level does end up mattering — it shapes profits over time — but the day's reaction turns entirely on the surprise, for what was expected had already been paid for.
This asymmetry has a practical consequence that rejoins the second chapter's lesson in humility: this panorama must not be read as an invitation to bet on announcements. In the second following the release, machines have already processed the number, and the consensus already reflected the collective intelligence of the professionals; at that game, the saver arrives systematically after the battle. The dashboard's value lies elsewhere: not guessing the weather of 2:30 p.m., but understanding the climate — knowing which regime one is in, what prices already assume, and where your portfolio is vulnerable.
What the investor must take from this
From this tour of the horizon, three reflexes deserve to be carried away, for they will serve in every chapter to come.
The first: every piece of macroeconomic news is read with the fraction. Faced with any headline — "growth surprises," "inflation rebounds," "the central bank pauses" —, ask the same two questions: which floor does this touch, the top, the bottom, or both? and which of the two effects dominates in the current regime? This simple algorithm dispels most of the confusion — starting with the paradox of good news that sends the stock market down.
The second: distinguish the surprise from the level, for they work on different horizons. The surprise makes the day's reaction; the level and its duration make the returns of years. An inflation number that surprises by 0.2 points agitates one session; inflation lodged two points above interest rates gnaws at a fortune decade after decade. The long-term saver can ignore the first; he cannot ignore the second.
The third: read the dashboard as a system, never dial by dial. The six variables of this chapter are the organs of one body, tied together by loops — and at the center of the system sits the central bank, which watches the same dials as you and whose reaction is part of the game. That is why an identical number can be good one year and bad the next: it is not the number that changed, it is the regime.
Key takeaway — A handful of variables — growth, inflation, interest rates, employment, under the baton of the central bank, with exchange rates and energy in the background — commands most of what happens to your investments. Each acts through a precise channel on the top or the bottom of the fraction that sets the price of every asset — and often on both at once, which is why good economic news can be bad stock-market news. In the short run, it is the surprise against consensus that moves prices; in the long run, it is levels and regimes. And no dial is ever read alone.
The rest of the journey
This chapter closes the setting of the stage: we now know why macroeconomics concerns the saver, at what scale it reasons, and which great variables populate its dashboard. The map is drawn; the territories remain to be explored. The coming modules will do so in order: growth and GDP first, then money and its creation, inflation and its measurement, and finally interest rates in all their facets.
But before opening the first of those territories, one step is in order. You have met in this chapter basis points and policy rates, nominal and real, a consensus and regimes; trading floors speak a dense language, where every term is a shortcut for a mechanism. The next chapter will build that survival lexicon: the essential vocabulary of financial macroeconomics, explained without jargon, so that no word ever again stands between you and the ideas. Until then, let us keep the compass this panorama leaves us: faced with any economic news, always ask which floor of the fraction it touches — and remember that the market had already placed its bet on the answer.
Sources and further reading
- John Boyd, Jian Hu & Ravi Jagannathan, "The Stock Market's Reaction to Unemployment News: Why Bad News Is Usually Good for Stocks," Journal of Finance (2005) — the empirical demonstration that the same employment news is good or bad for stocks depending on the phase of the cycle.
- Warren Buffett (edited by Carol Loomis), "Mr. Buffett on the Stock Market," Fortune, November 22, 1999 — the image of interest rates acting on valuations the way gravity acts on matter.
- Ben Bernanke & Kenneth Kuttner, "What Explains the Stock Market's Reaction to Federal Reserve Policy?," Journal of Finance (2005) — the measurement of stocks' reaction to unanticipated Fed decisions (about +1% for a surprise quarter-point cut).
- Irving Fisher, The Theory of Interest (1930) — the distinction between nominal and real rates and the role of expected inflation.
- A. W. Phillips, "The Relation between Unemployment and the Rate of Change of Money Wage Rates in the United Kingdom, 1861-1957," Economica (1958) — the empirical link between labor-market tightness and wage growth.
- Arthur M. Okun, "Potential GNP: Its Measurement and Significance" (1962) — the statistical relation between growth and unemployment, known as Okun's law.
- Martin Zweig, Winning on Wall Street (1986) — "Don't fight the Fed": the weight of monetary conditions on stock prices.
- Data for the 2019-2025 figure: Bureau of Labor Statistics (consumer price index, series CPIAUCSL) and Federal Reserve (upper bound of the policy rate, series DFEDTARU), via FRED.