5. The Essential Vocabulary of Financial Macroeconomics, Without the Jargon
· 27 min read
Open a financial news site on the evening of a Federal Reserve meeting, and read the first dispatch you find: "The Fed opted for a hold, but a statement judged hawkish flattened the curve; markets, which had already priced in the pivot, are lifting their terminal-rate expectations, and the consensus now looks for a soft landing." For the professional, those three lines are a model of density: they sum up the state of the monetary world better than a long report. For everyone else, they are a wall. Almost every word looks like English, and yet the sentence slides past without giving a grip, like a conversation overheard in a language once learned, then forgotten.
That feeling of exclusion deserves a pause, for there is nothing innocent about it. Every profession compresses its knowledge into shortcuts — doctors, lawyers and sailors have theirs —, and that kind of jargon is legitimate: it saves time among people who share the same references. But financial vocabulary has two peculiarities. The first: it talks about your money, and you cannot afford the luxury of not understanding it. The second: it sometimes serves less to say than to impress. John Kenneth Galbraith, one of the most widely read economists of the twentieth century, wrote it bluntly: the study of money is, of all the fields of economics, the one in which complexity is used to disguise the truth or to evade it, rather than to reveal it.
This chapter was born of the opposite conviction: everything this vocabulary compresses can be said simply. The previous panorama ended on a promise — to build a survival lexicon before exploring each territory on the map. Here it is. Not an alphabetical dictionary, consulted and forgotten, but a guided tour, family by family: the words of measurement, the nominal-real pair, stocks and flows, the words of the cycle, of prices, of the central bank, of rates, of the market, and those of the state and the world. Nearly a hundred terms in all — it may sound like a lot, but most come in pairs and flow from a handful of mechanisms: with them, nearly all of economic news opens like a book.
Keep within reach, finally, the fraction laid down in the first chapter — expected future income on the numerator, the discount rate on the denominator. It is the grammar of this language: most of the words that follow are merely labels stuck on one of its two floors, or on the loops that tie them together. At the end of the chapter, we will reread the opening dispatch together; you will see that it has become transparent.
Jargon: compression, not intelligence
Before unrolling the lexicon, one clarification, which is also a method. A technical term is never anything but a mechanism folded into a word. "Curve inversion" compresses into two words a complete story — short rates rising above long rates because the market anticipates cuts to come. Whoever knows the story saves time by saying the word; whoever does not know it hears only a password. The knowledge is not in the vocabulary, it is in the mechanism: learning the word without the mechanism is reciting a language one does not speak.
Hence the rule that will guide this whole chapter: faced with an obscure term, do not ask what the word means, ask what it compresses. Any honest explanation must be able to unfold into simple gestures — who buys, who sells, what rises, what falls, which floor of the fraction moves. If an explanation never lets itself be unfolded, the problem does not come from you. George Orwell, in a famous 1946 essay on language and politics, made a principle of it: the great enemy of clear language is insincerity. Finance is no exception to the rule — and your best defense is precisely the lexicon that follows.
The words of measurement: levels, changes and basis points
Let us begin with the most discreet and most treacherous family: the words that say how to read a number. An indicator is a statistical series published at regular intervals — May's inflation, the quarter's unemployment. Faced with any of them, the first question is never "how much?" but "are we talking about the level, or the change?". Confusing the two is probably the most widespread reading error in the economic press. When a headline announces that "inflation is falling," it says that prices are rising more slowly — not that they are falling: inflation is already a change, the change in prices, and its decline is a slowing of the rise, not a reversal. The running thread of this journey offers the perfect illustration: between 2022 and 2025, American inflation fell back from nearly 9% toward 2 to 3%, and not a single month of that long descent saw the price level decline.
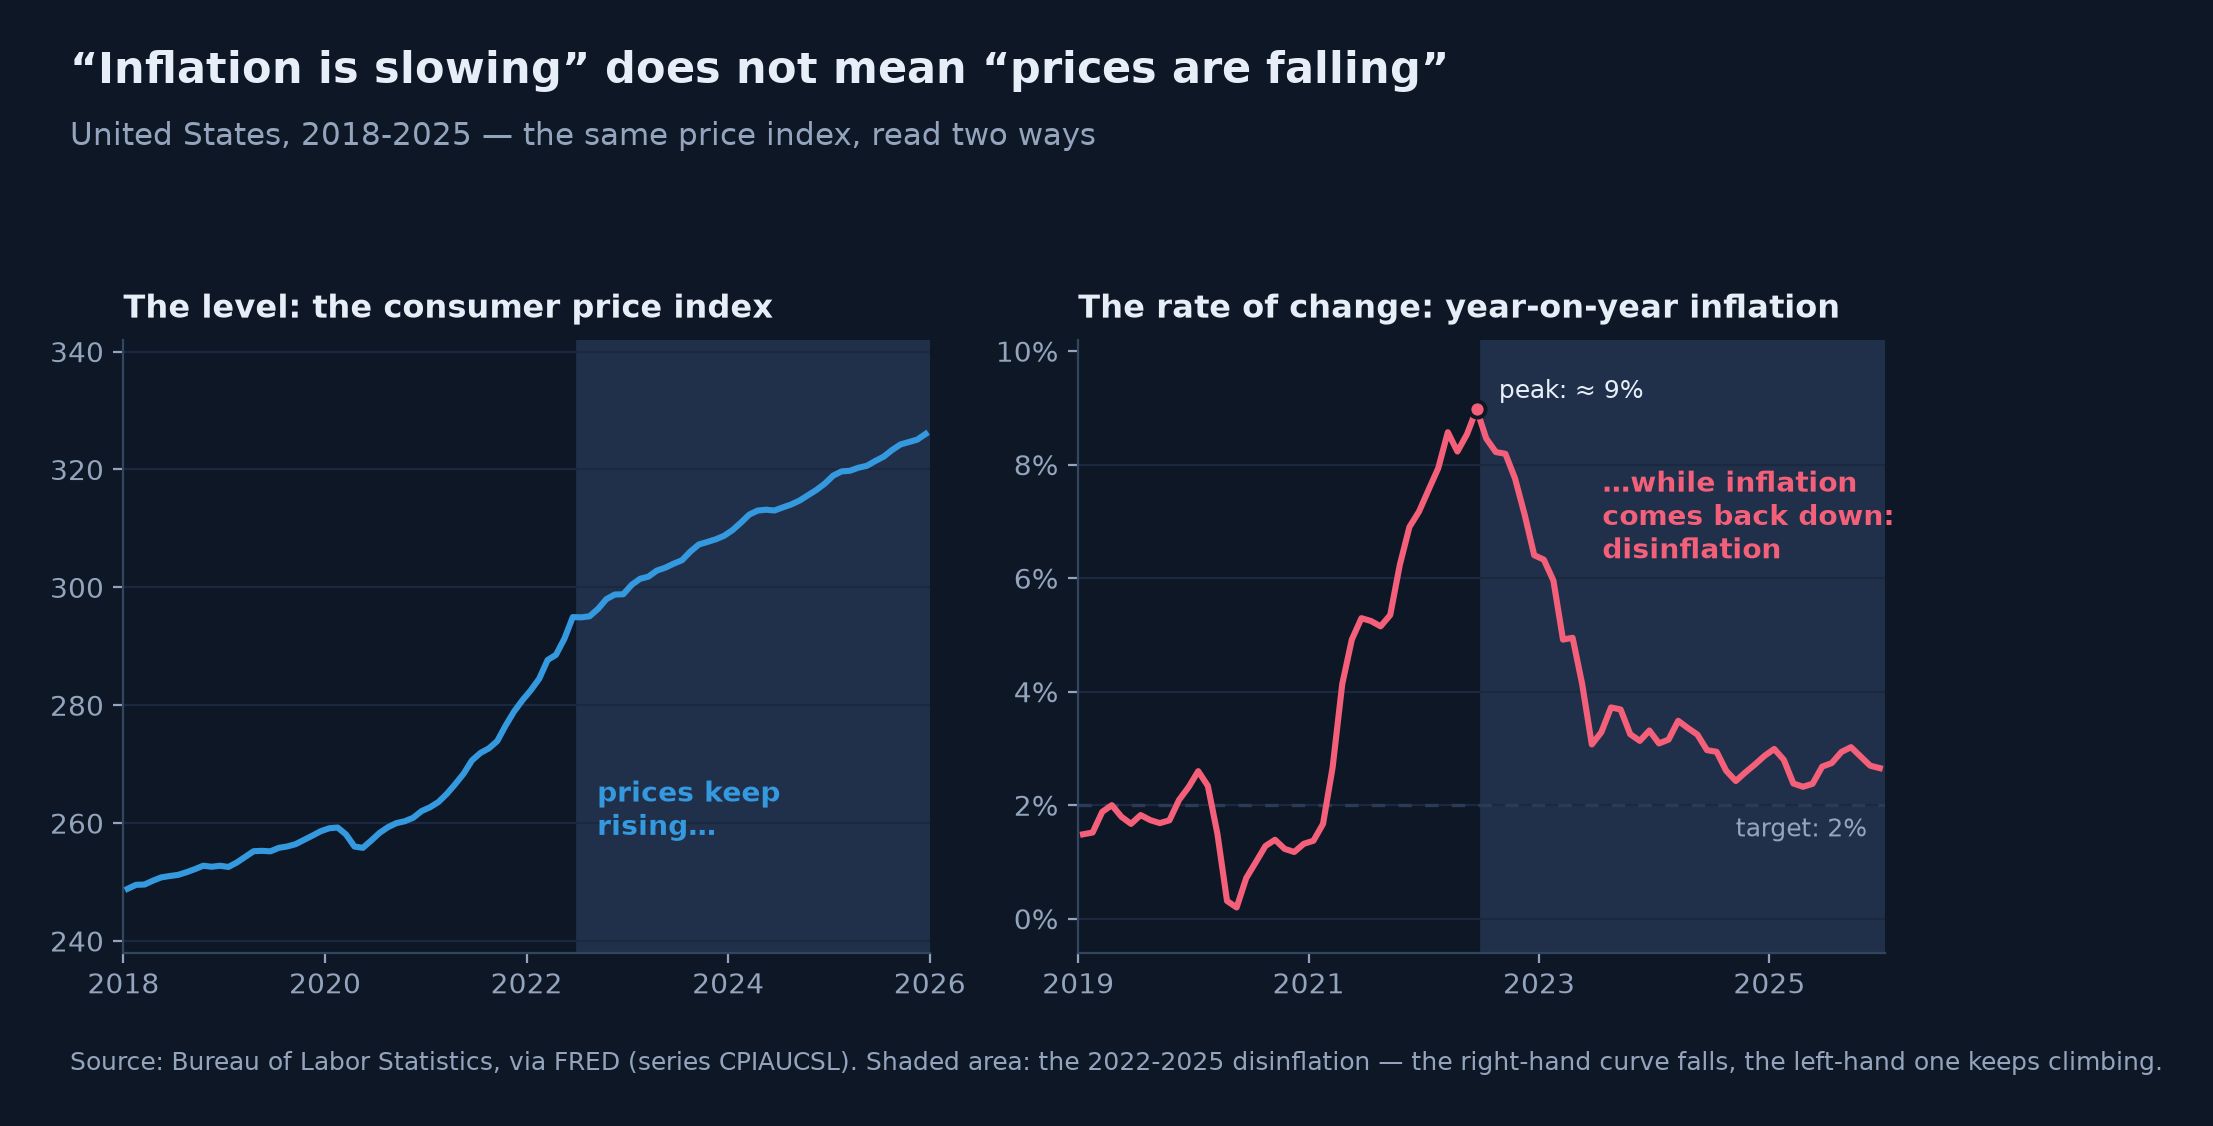
The same price index, read two ways. On the right, inflation — a rate of change — falls back spectacularly after 2022: that is disinflation. On the left, the price level never comes back down. Whoever confused the two curves waited in vain for the old prices to return.
Around this distinction gravitate a few reading companions. The year-on-year change compares a month with the same month a year earlier — the "over one year" of the dispatches — while the annualized rate extrapolates the recent trend as if it lasted twelve months. Series are often seasonally adjusted, that is, cleaned of the jolts that repeat every year at the same date — otherwise December, Christmas sales oblige, would look every year like a retail boom. And because first estimates are produced fast, they are subsequently revised — sometimes to the point of changing a quarter's sign; we will come back to this in the very next chapter.
There remains the unit of account of the trading floors: the basis point. A basis point is one hundredth of a percentage point; one hundred basis points make one point. When the central bank "raises rates by 25 basis points," it lifts them by a quarter of a point — from 4.00% to 4.25%, say. The vocabulary sounds mannered; it actually corrects a real ambiguity of everyday language, where "rates rise by 0.5%" can mean half a point or a 0.5% rise in proportion — two unrelated things. Keep the neighboring reflex for percentages themselves: a rate that goes from 2% to 3% rises by one percentage point, but by half in proportion — and some headlines play, sometimes knowingly, on the two readings.
Nominal and real: the most important pair in the lexicon
If you were to keep only one pair of words from this whole chapter, it would be this one. A quantity is nominal when it is expressed in current euros, as they appear — on your bank statement, your payslip, your contract. It is real when it is corrected for inflation, that is, converted into purchasing power: not "how many euros?" but "how many grocery carts, rents, tanks of fuel?". The distinction, formalized by Irving Fisher nearly a century ago and already met in the panorama, fits in one approximate but robust subtraction: the real return is the nominal return minus inflation.
The whole stake comes from the fact that your financial life is displayed in nominal and lived in real. A savings account at 3% "pays," says the statement. If inflation is at 5%, it impoverishes: every year, the savings lose about two points of purchasing power, silently, without a single line of the statement ever admitting it. It is the panorama's silent thief, seen this time from the vocabulary side: the negative real rate.
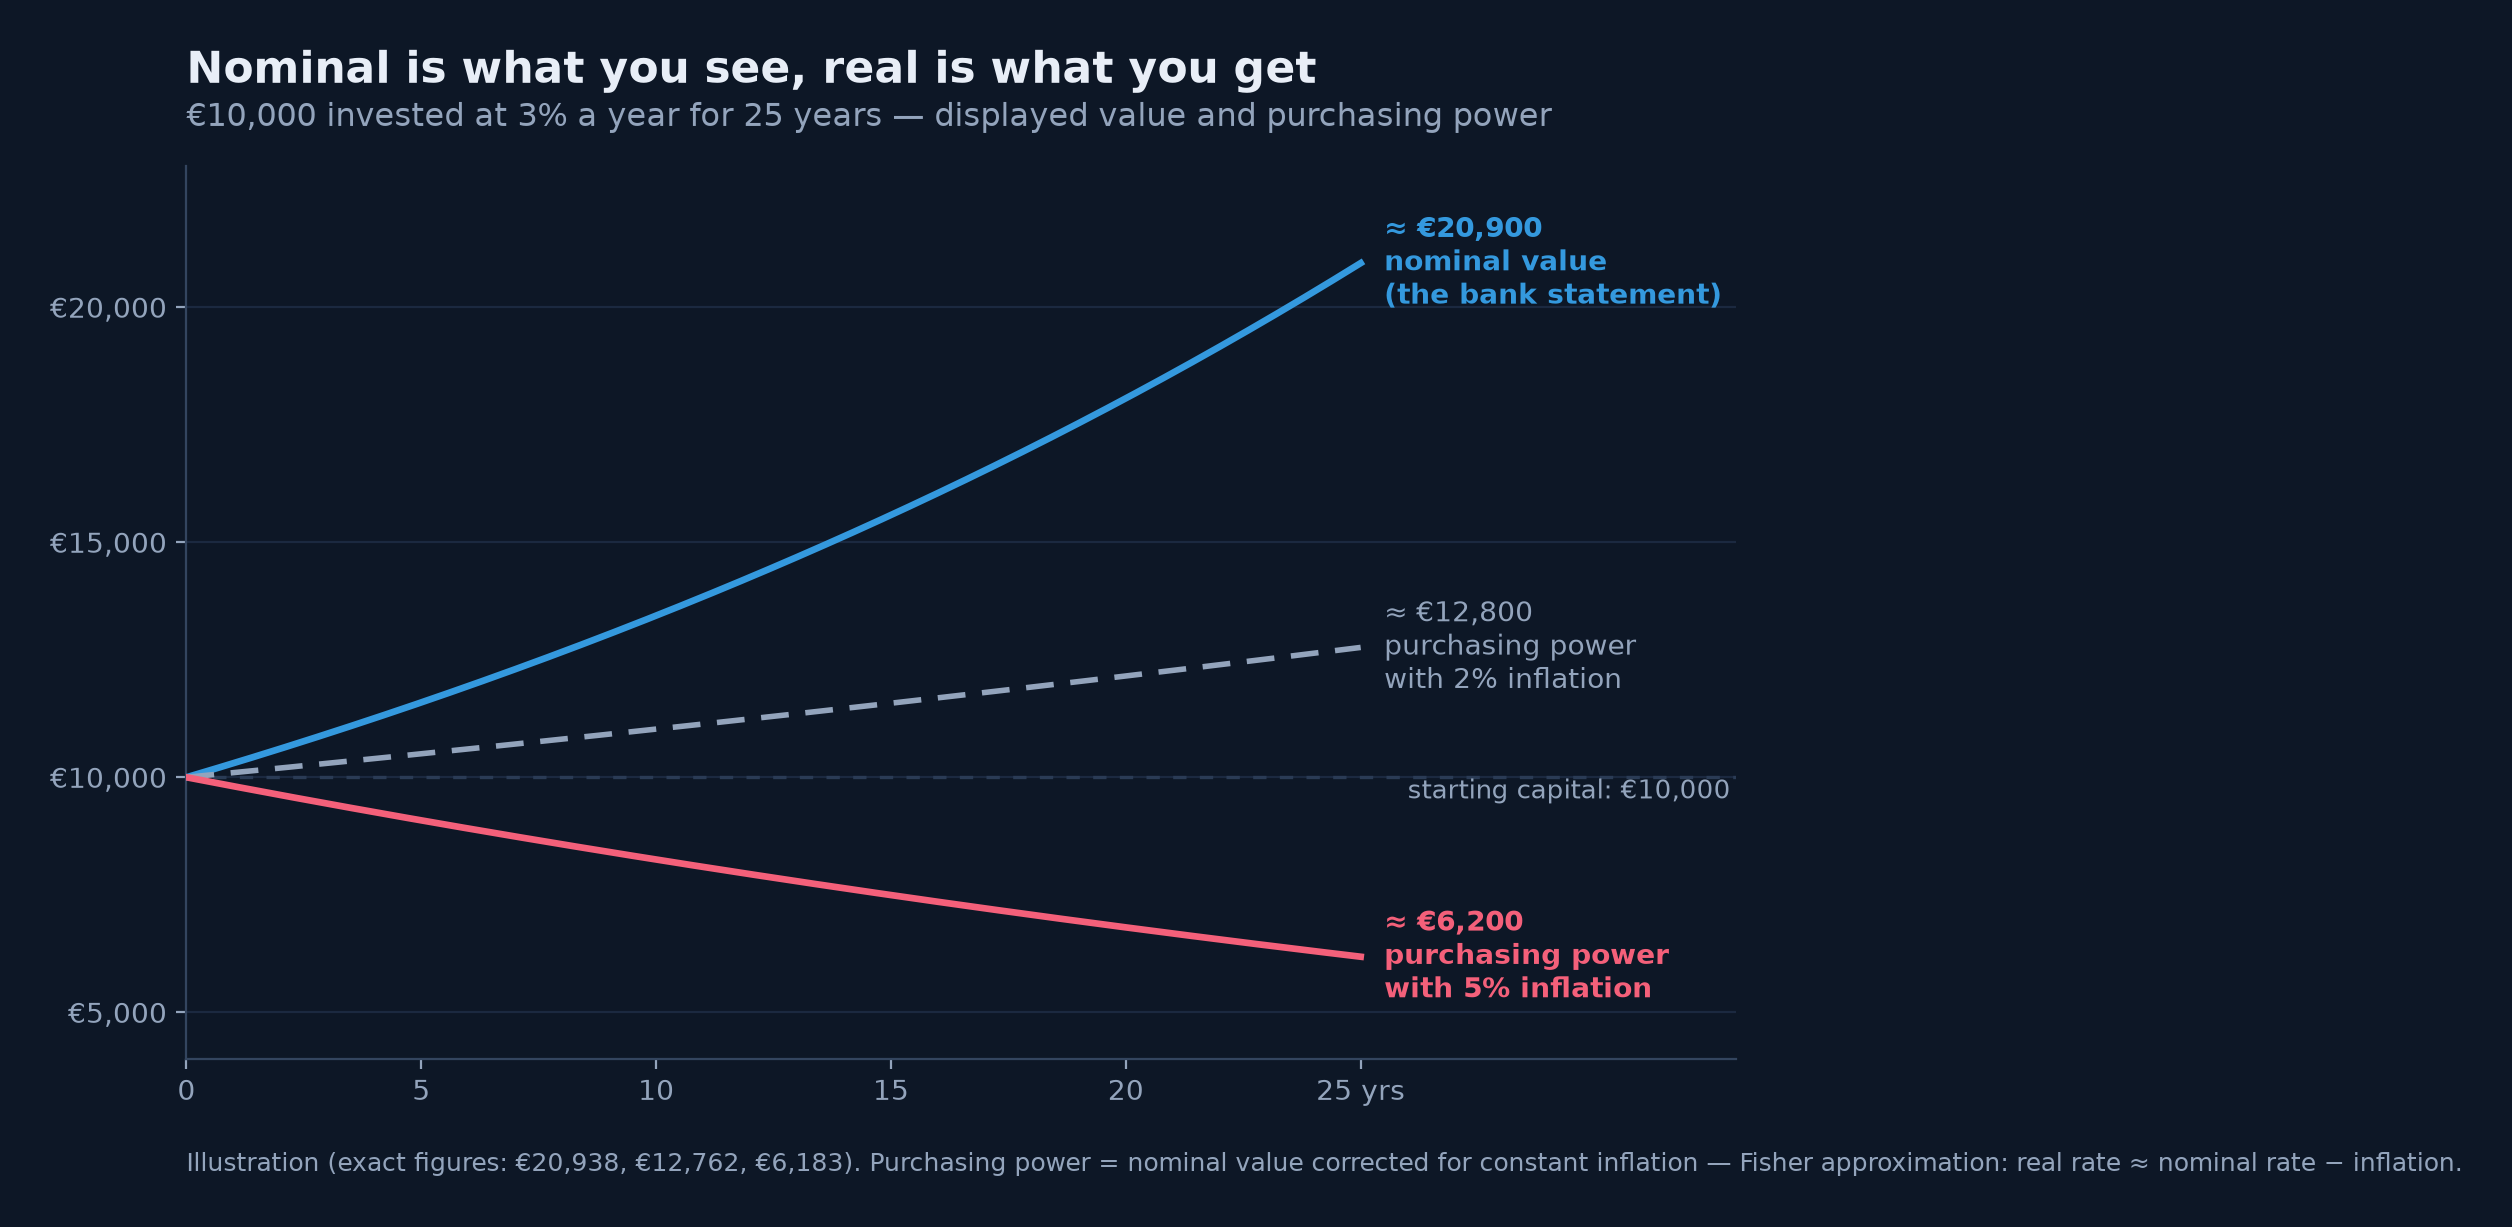
Three stories for one investment at 3%. The bank statement (blue) nearly doubles in twenty-five years. With well-behaved 2% inflation, purchasing power (gray) advances: the real rate is positive. With 5% inflation, the same investment "that pays" melts from €10,000 to about €6,200 of purchasing power: the counter rises, the wealth falls.
Once the pair is acquired, you will see it everywhere, for nearly every macroeconomic quantity exists in two versions. Wages: a 3% raise under 5% inflation is a cut in the real wage — the 2021-2022 episode reminded millions of households of it painfully. GDP: the next module will show why growth is only measured in real GDP, the only one able to distinguish producing more from selling dearer. Rates, finally: the real rate is the true reward of patience, and some investments, said to be indexed to inflation, promise precisely a real rather than nominal return — the inflation module will detail those protections. Keep the reflex: in front of any figure in euros or in percent, ask yourself whether it is nominal or real.
Stocks and flows: the debt is not the deficit
Second structuring pair, and second lode of confusion: the stock and the flow. A flow is measured per period — so many euros per month, so many billions per year; a stock is measured at an instant — so many euros on December 31. The canonical image is the bathtub: the tap's flow rate is a flow, the water level is a stock. Turning down the tap does not empty the tub; as long as the tap runs, the level rises — more slowly, but it rises.
This hydraulic evidence dissolves one of the most stubborn misunderstandings of public debate. The public deficit is a flow: the gap, over one year, between what the state spends and what it takes in. The public debt is a stock: the accumulation of all past deficits, minus the rare surpluses. When a government proudly announces that "the deficit is shrinking," it is only saying that the tap runs less hard; the debt, meanwhile, keeps rising. No paradox, no lie — just two words that everything distinguishes and that everyday conversation confuses.
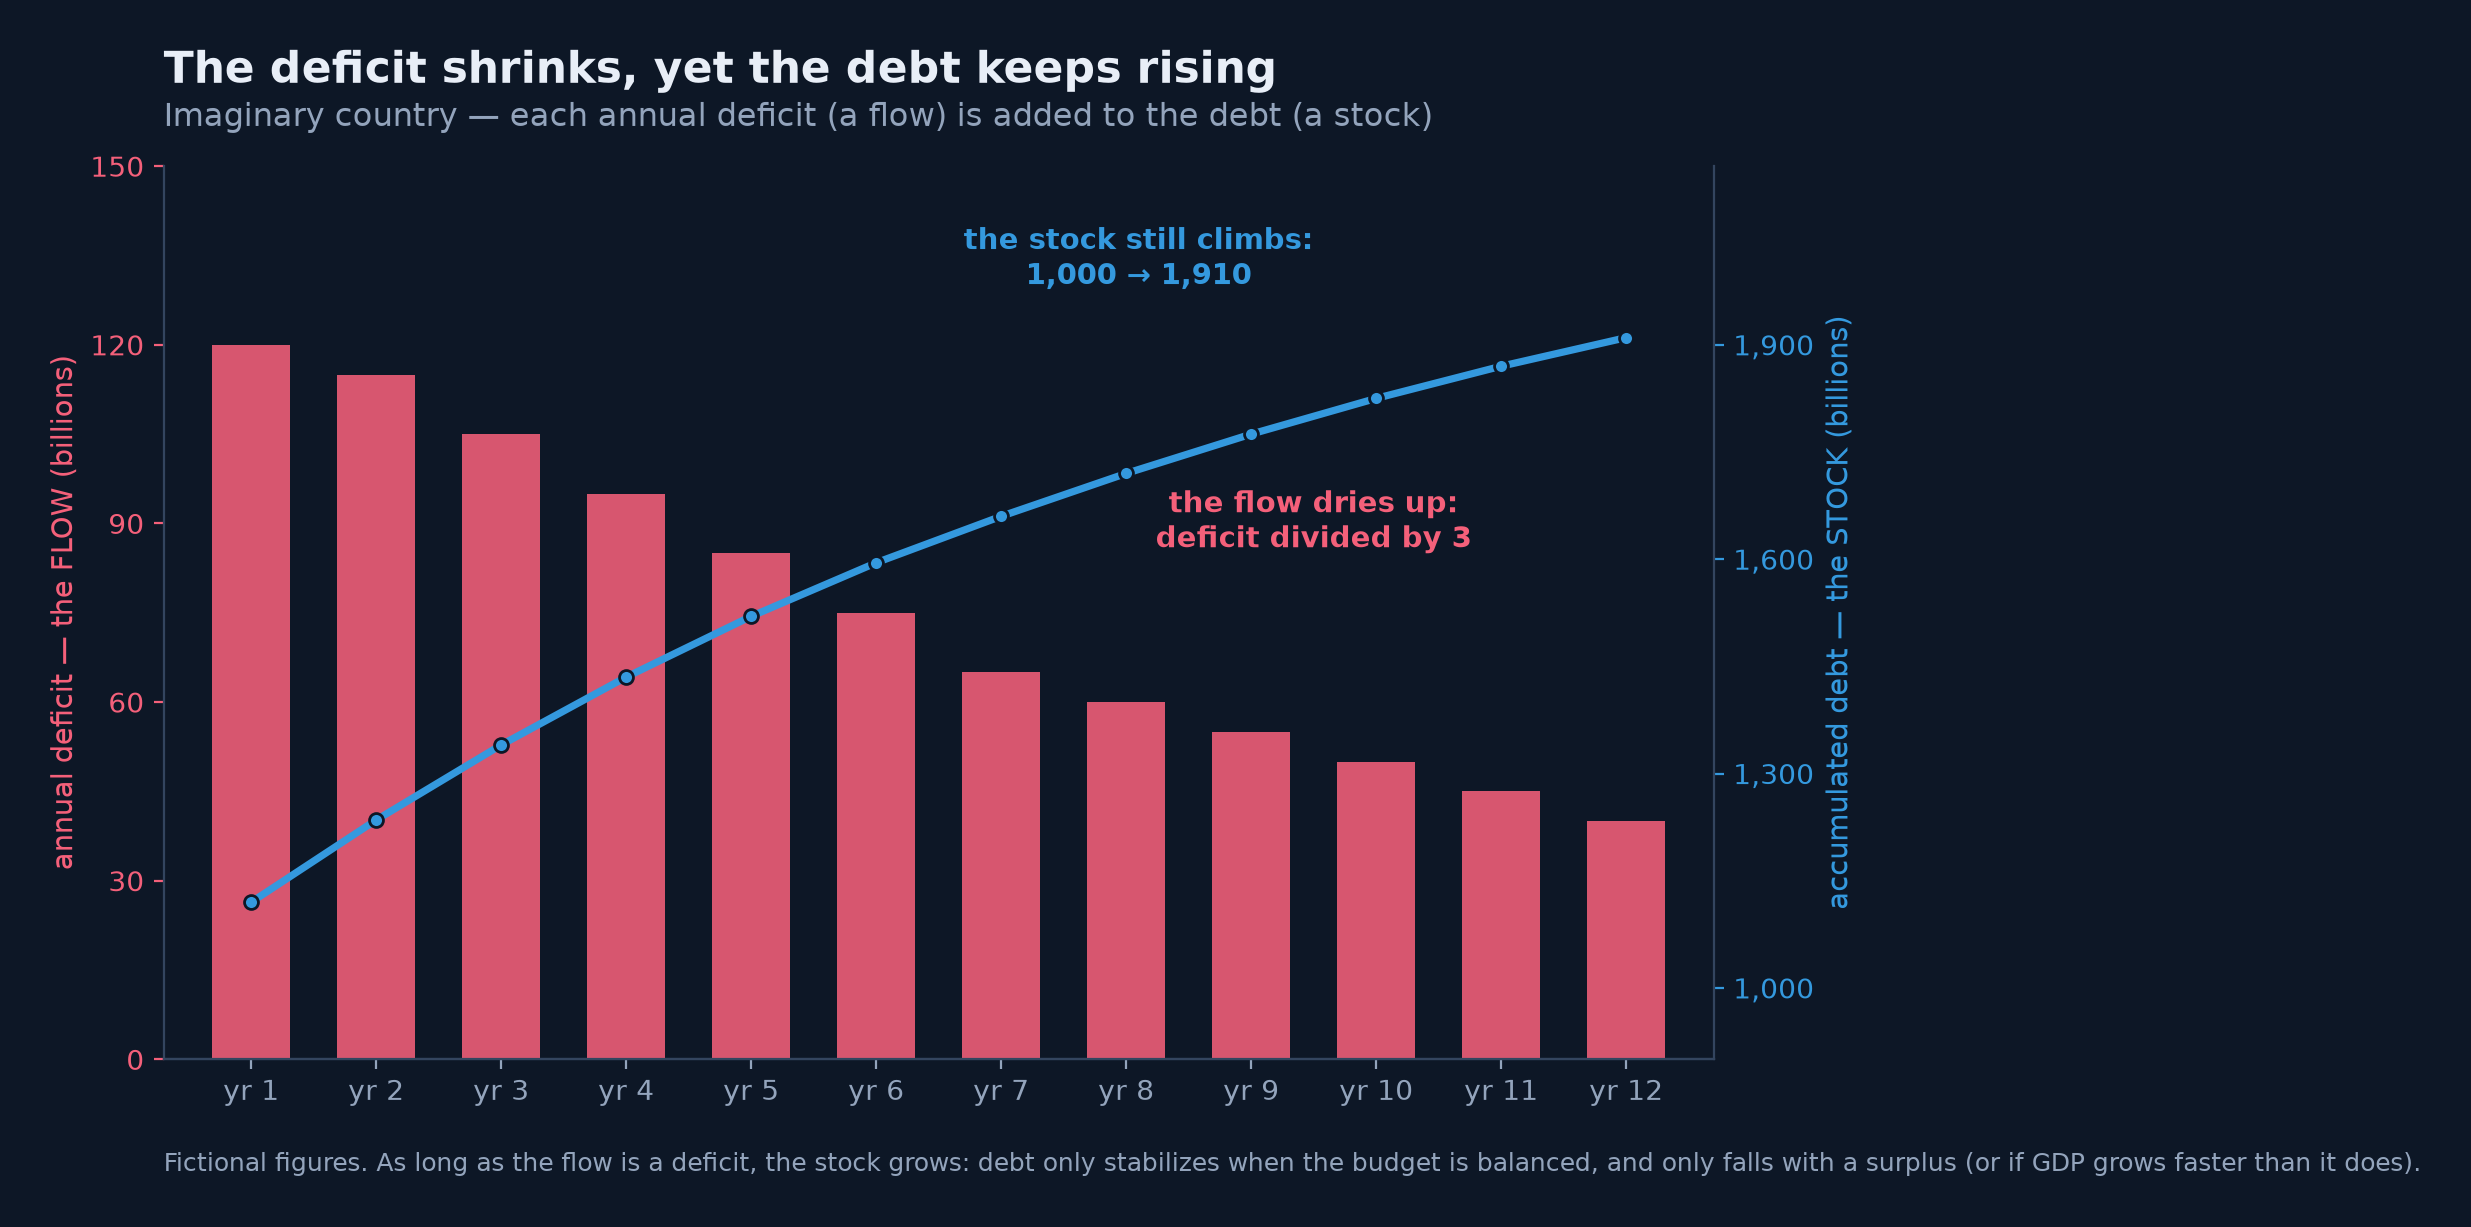
Twelve years of an imaginary country. The flow (the bars) is divided by three: fiscal rigor, triumphant headlines. The stock (the curve) still grows by nearly half, for a reduced deficit is still a deficit. Debt only stabilizes at a balanced budget, and only recedes with a surplus — or when GDP grows faster than it does.
The pair sheds light far beyond public finances. Your income is a flow, your wealth is a stock, and your saving is the flow that links one to the other. The trade balance — exports minus imports over a period — is a flow. And when you read that a country's debt "reaches 110% of GDP," you are comparing a stock with one year of flow: exactly like a household that owes its bank 1.1 years of income — a banal situation for anyone repaying a mortgage. The ratio impresses less once you have seen that it divides two things of different natures.
The words of the cycle: from expansion to landing
The economy does not advance in a straight line: it breathes, in phases that the vocabulary carves up with precision. The business cycle strings together the expansion — activity grows —, the peak, the contraction — it recedes —, the trough, then the recovery. When the expansion runs out of breath without reversing, we speak of a slowdown; when demand durably exceeds what the productive apparatus can supply, the economy is overheating — lengthening delays, shortages, accelerating prices.
The heaviest word in the family is the recession. Its everyday definition — the "technical recession" — is two consecutive quarters of falling GDP. But the United States defers to a committee of NBER economists, which dates cycles by a richer definition: a significant decline in activity, spread across the economy, lasting more than a few months. The nuance is not byzantine: in the first half of 2022, the first estimates showed American GDP falling two quarters in a row — a technical recession in the strict sense —, and the NBER never declared a recession, employment remaining exceptionally solid. Two honest definitions, two opposite verdicts: that is why vocabulary is worth working on. Beyond it, the depression — the word of the 1930s — denotes the long, deep collapse; it is, fortunately, almost never used rightfully.
There remain the words of altitude, omnipresent in our 2020-2025 running thread. The soft landing is every central banker's dream: bringing inflation back to target by braking the economy without tipping it into recession; the hard landing is the symmetrical failure. The aeronautical metaphor captures the difficulty well: the economist Alan Blinder, surveying American monetary tightenings since 1965, counts only a handful of fully successful landings — 1994-1995 as the textbook case, since joined by the sequence of our running thread. As for the worst of worlds — activity stagnating with high inflation —, it bears a portmanteau name that stuck: stagflation, a contraction of stagnation and inflation, coined in 1965 by the British MP Iain Macleod to describe "the worst of both worlds," and which became the label of the 1970s.
One last trio for reading dashboards: leading indicators, which turn before activity — building permits, orders, purchasing managers' surveys —, coincident indicators, which track it in real time, and lagging indicators, which only confirm after the fact, unemployment first among them. Markets, which live on expectations, scrutinize mostly the first; newspapers comment mostly on the last.
The words of prices: inflation, disinflation, deflation
The price family has felt familiar since the panorama — inflation is the general and lasting rise of prices, measured by the consumer price index, the cost of a basket representative of household consumption tracked month after month. But it is around inflation that the most misunderstood nuances flourish, and the heaviest ones for a portfolio.
The first, the figure at the start of this chapter showed it: disinflation is the slowing of inflation — prices rise more slowly —, whereas deflation is negative inflation — prices genuinely fall, generally and durably. One is the scenario central banks hope for; the other terrifies them. For entrenched deflation sets vicious circles going: households postpone purchases — why pay today what will cost less tomorrow? — and, above all, the real weight of debts grows heavier, incomes falling while installments stay frozen in nominal terms. The Japan of the 1990s-2000s, which this journey will revisit as a case study, remains the modern demonstration of that trap. At the other extremity, hyperinflation — which economists, since Philip Cagan, conventionally define as price rises exceeding 50% per month — is the destruction of money itself: in the Germany of 1923, prices doubled in a matter of days. A very rare episode, but one that explains some countries' long memory on the subject.
Two refinements complete the toolkit. Core inflation removes energy and food from the calculation, not because they do not count, but because their prices, too volatile, blur the signal: it is the underlying trend the central bank watches in order to decide. And inflation expectations — what households, firms and markets believe inflation will be — matter almost as much as inflation itself, for they are self-fulfilling: whoever expects 5% negotiates a 5% raise, which the employer passes on into prices. As long as expectations stay anchored near the target of about 2%, a price shock remains an episode; if they de-anchor, it becomes a wage-price spiral — the mechanism documented by Phillips that the panorama has already met. That is why central bankers talk so much: their job consists, in large part, of holding the anchor.
The words of the central bank: hawks, doves and pivots
No institution has bred more vocabulary than the central bank — naturally, for the actor whose every adjective makes the fraction's denominator tremble. Its toolbox first. The policy rate, as we have seen, is the overnight rent of money; raising it is tightening monetary policy, lowering it is easing. When the rate already touches zero — the zero lower bound, which all the major central banks approached after 2008, the ECB even going, from 2014 to 2022, as far as negative deposit rates —, there remains the heavy weapon: quantitative easing, the famous QE, by which the central bank creates money to buy bonds massively, government bonds in particular, and so press down the long rates its policy rate cannot reach. The operation swells its balance sheet; the reverse operation — letting securities mature without replacing them, or even selling them back — is called quantitative tightening, QT. These mechanisms will have their chapters; at the lexicon stage, keep the image: the policy rate steers the short end, the balance sheet weighs on the long end.
The bestiary next, for the markets have populated the institution with a veritable aviary. A central banker is a hawk — hawkish — when leaning toward firmness against inflation, higher rates for longer; a dove — dovish — when favoring support for activity and employment. An entire statement is called hawkish or dovish according to the side toward which it tilts expectations — which is how a single adjective moves trillions. A hold designates a meeting without a rate change; a pause, a hold one hopes is temporary; the pivot, the moment the course reverses — from hikes to cuts, or the other way. The terminal rate, finally, is the summit the market lends to the ongoing tightening cycle: it was the great riddle of 2022-2023 in our running thread, settled at 5.25-5.50%.
There remains the most astonishing weapon: speech. Forward guidance consists of announcing in advance the probable trajectory of rates, precisely because markets live on expectations: handled well, the word does part of the rates' work. It is a complete historical reversal. Forty years ago, the doctrine was opacity — Alan Greenspan, freshly appointed to head the Fed, joked in 1987 before a congressional committee: "Since becoming a central banker, I have learned to mumble with great incoherence. If I seem unduly clear to you, you must have misunderstood what I said." The word Fedspeak stuck as the name of that deliberately foggy tongue. Modern central banks do the exact opposite — press conferences, projections, guidance —, not out of virtue, but because they have understood that managing expectations is managing the economy. One last chameleon word: liquidity. Depending on context, it designates the ease of selling an asset without moving its price, or the abundance of money available in the financial system. When a commentator says that "liquidity is supporting markets," the second sense is meant — the module on money will deal with it fully.
The words of rates: curve, spreads and premiums
The panorama introduced interest rates as the gravity of asset prices; here is the vocabulary that goes with it. A bond is a loan cut into tradable securities: the issuer — state or company — pays a periodic interest, the coupon, and repays at maturity. The yield is what the security really pays whoever buys it at today's price: that is why price and yield move in opposite directions, a mechanism already glimpsed that a chapter of the rates module will take apart piece by piece, with duration — the price's sensitivity to rate moves — as the measuring instrument.
Three words then organize the hierarchy of yields. The risk-free rate is that of the borrower judged safest — in practice, the big states in their own currency: it is the bar every investment must clear. Everything riskier must pay more: that supplement is the risk premium. And the yield gap between two borrowers is called a spread: the spread between a company and its government, the spread between Italy and Germany — the very one that served as thermometer of the euro-area crisis, another case study awaiting us. When a spread widens, the market is afraid; when it tightens, it breathes. It is one of the best fear gauges there is — more reliable, often, than the commentary.
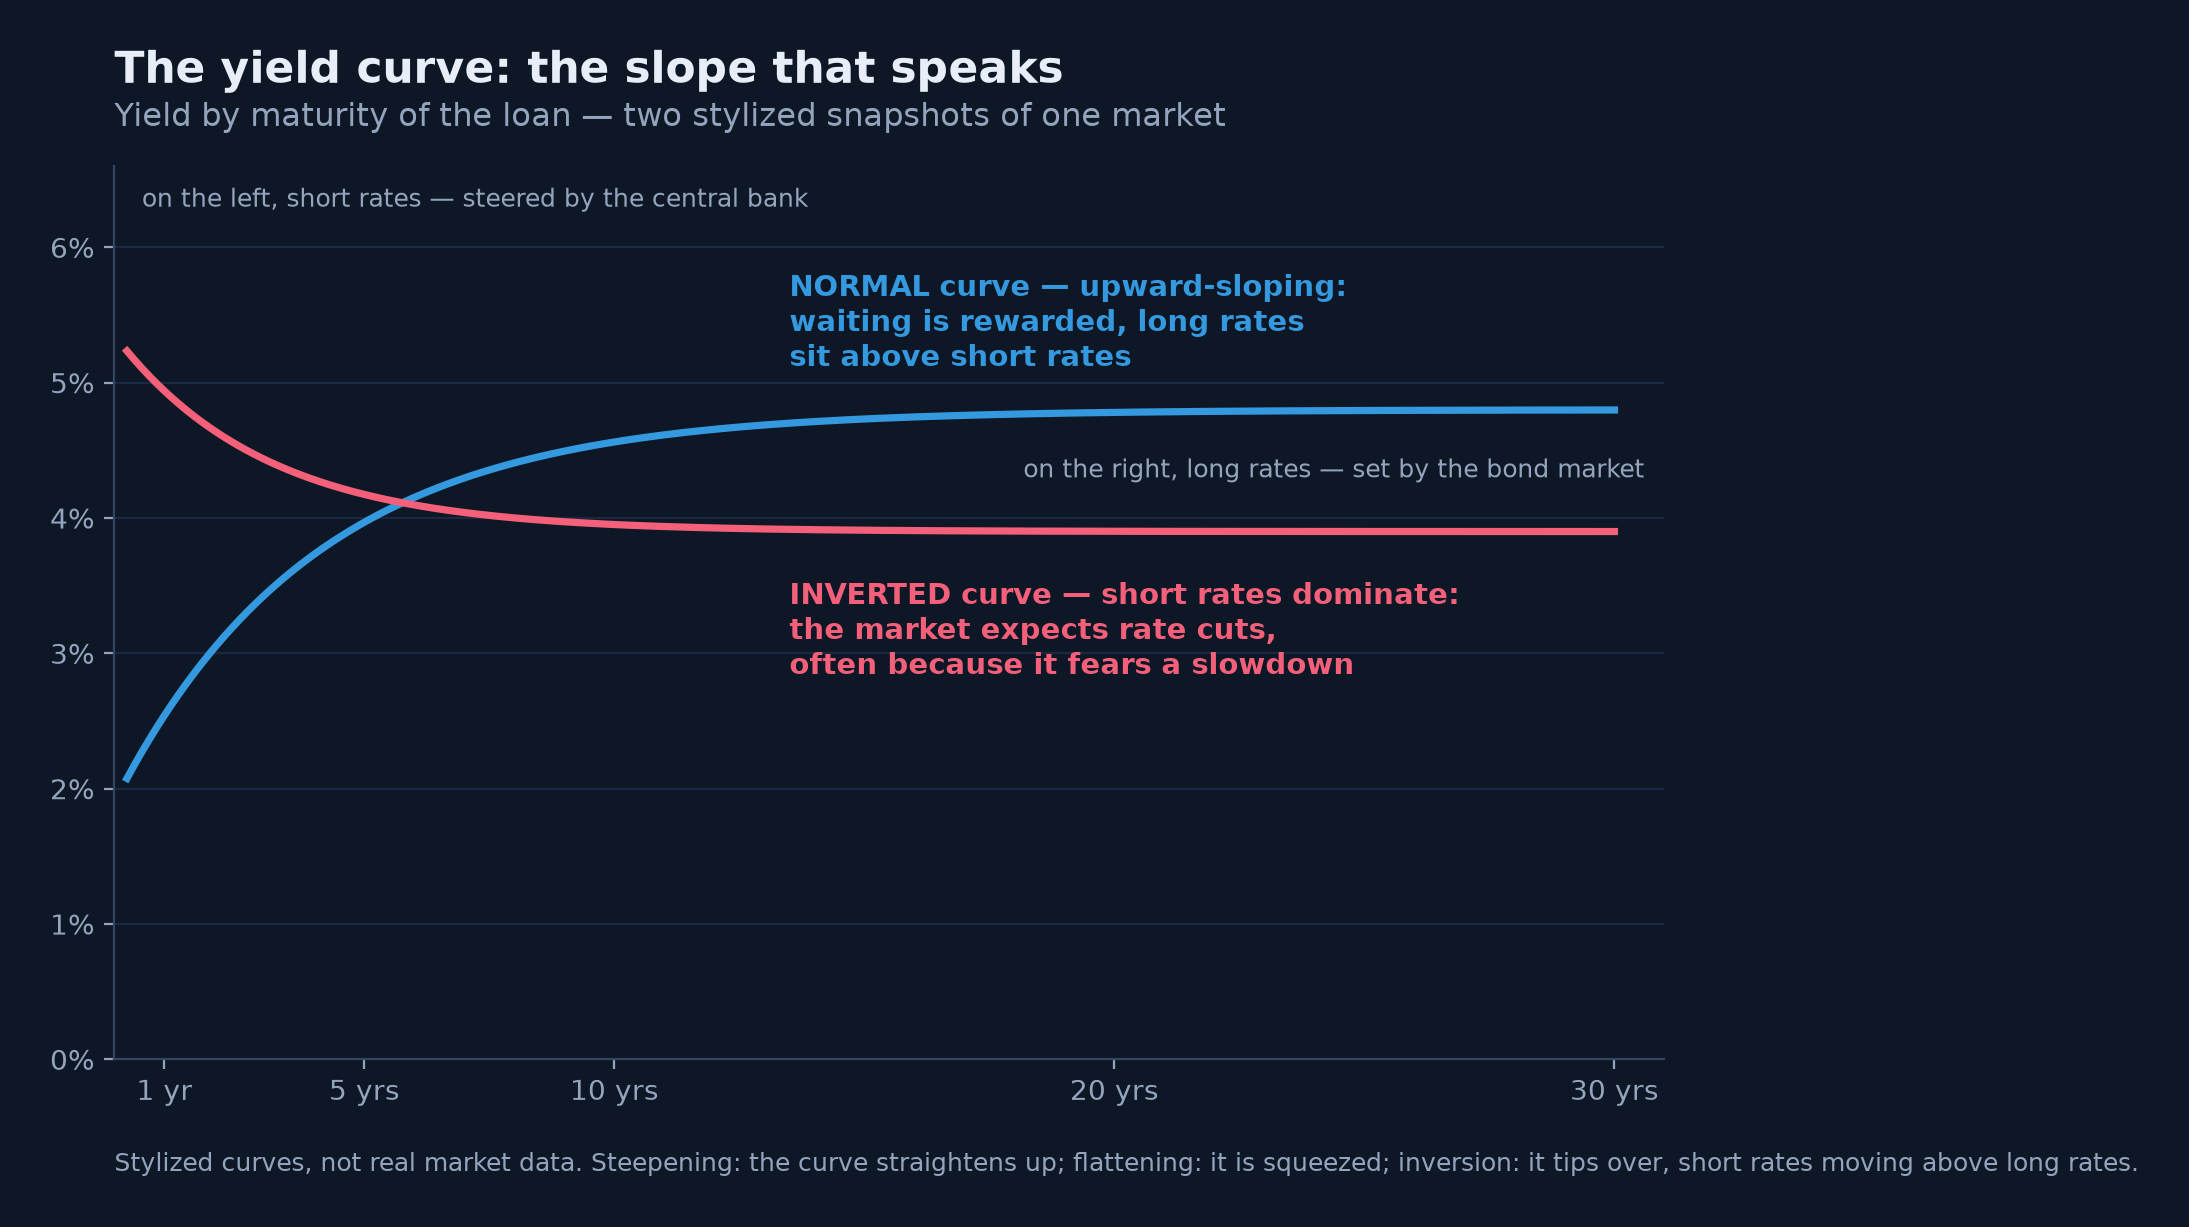
The yield curve links one borrower's yields across all maturities — here two stylized snapshots. In blue, the normal configuration: lending for longer pays more. In red, the inverted curve: short rates, steered by a central bank at war, exceed long rates, where the market is already betting on cuts. The slope reads like a sentence.
There is not one rate but a complete range, from overnight to thirty years, and the line that joins them — the yield curve — is perhaps the most commented object in finance. Its slope speaks: the curve steepens when the gap between long and short rates grows, flattens when it shrinks, inverts when short rates move above long rates. Inversion is the star configuration, for it has preceded most American recessions of recent decades — the work of Arturo Estrella and Frederic Mishkin made it one of the most studied leading indicators. A star, but no oracle: the 2022-2024 inversion, one of the longest ever observed, was not followed — at least through the end of 2025 — by the recession it was said to announce. Our running thread serves here as a guardrail: a leading indicator is a probability, never a prophecy.
The words of the market: bulls, bears and "priced in"
There remain the words the markets gave themselves — the most folkloric part of the lexicon, and yet indispensable, for it is the one that saturates the headlines. A bull market is a long, broad phase of rising prices; a bear market its opposite, which journalistic convention starts at a 20% fall from a peak. Below that, a drop of about 10% is only a correction — the word says the dominant reading well: an excess being reabsorbed. The crash is the brutal fall concentrated in a few sessions; the rally the sharp climb back; the bubble, a rise disconnected from any reasonable value — a word to handle with care, since bubbles only let themselves be identified with certainty after the fact. The animal origin is lost in eighteenth-century London: tradition ties it to the dealers who sold the bearskin before killing the bear, the bull later joining the bear as its fighting-ring adversary; the etymology is uncertain, the image stuck — the bear strikes downward, the bull gores upward.
A few measuring instruments next. Volatility is the amplitude of a price's variations — a volatile market moves a lot, in both directions; this journey's statistics module will make it a precise quantity. Its most famous thermometer, the VIX, computed from option prices on the American S&P 500 index, earned the nickname of "fear index." In storms, capital retreats toward safe havens — gold, the dollar, the bonds of the safest states: that is the risk-off regime, as opposed to risk-on days when appetite for risk dominates. Two binary labels, almost caricatures, but they describe well those days when everything rises or everything falls together.
And then there is the queen expression, the one that condenses half of this journey: "it's priced in." An event is priced in when the market has already anticipated and paid for it: its occurrence no longer moves prices. It is the direct application of the panorama's lesson — the surprise makes the reaction, not the level — and the answer to one of the beginner's most frequent perplexities: "the news is excellent, why is nothing going up?" Because it was excellent and expected. The consensus — the average of economists' forecasts — serves precisely as the yardstick of that expectation. You already knew those two words: you were speaking the language without knowing it.
The state and the world: budgets, currencies and company
Let us complete the tour with the words of the economy's second pilot — the state — and those of the outside. Fiscal policy is the use of public spending and taxes to influence activity: it is the other macroeconomic lever, the government's, alongside the central bank's monetary policy. A stimulus raises spending or cuts taxes to support demand; austerity, or more modestly fiscal consolidation, does the reverse to reduce the deficit. Add the automatic stabilizers, an elegant mechanism requiring no decision: in a recession, tax receipts fall and benefits rise by themselves, deepening the deficit precisely when the economy needs it.
On the world side, the panorama has already introduced the exchange rate and imported inflation; the lexicon adds a distinction of rigor. A currency depreciates or appreciates when its price falls or rises on the market; it is devalued or revalued when a government changes by decision a parity it administers — the word therefore applies only to fixed exchange-rate regimes. Saying that "the euro was devalued" because it slid against the dollar is, strictly speaking, an abuse of language: the euro floats, it depreciates. Finally, the trade balance nets out exports and imports of goods; broadened to services and income, it becomes the current account, whose surpluses and deficits feed a considerable share of economic geopolitics — the module devoted to the dollar will return to it at length.
Learning a living language
What to do with this lexicon? Above all, not flashcards to recite. A language is learned by practicing it, and this one offers a free daily training ground: the economic press. The exercise fits in three gestures. Take one dispatch a day. Underline every jargon word and, for each one, unfold the mechanism it compresses — who buys, who sells, what rises. Then tie the whole thing back to the common grammar: which floor of the fraction is touched — the top, the bottom, both? In a few weeks, the effort becomes a reflex; in a few months, you will read the markets the way one reads one's mother tongue — without translating.
Let us do it one last time together, on the opening dispatch. "The Fed opted for a hold": the American central bank did not move its policy rate. "But a statement judged hawkish flattened the curve": the tone, firmer than expected against inflation, pushed short rates up relative to long rates. "Markets, which had already priced in the pivot, are lifting their terminal-rate expectations": investors, who were already betting on the turn toward rate cuts, are revising upward the summit they lend to this tightening cycle. "And the consensus now looks for a soft landing": the average forecast of economists is that inflation will return to target without a recession. The wall of the first paragraph no longer exists; there never was a wall — only mechanisms folded into words.
One last warning, which is almost a consolation: this language moves. Every crisis invents its words — QE imposed itself in 2008, the "pivot" flourished in our running thread —, and you will always meet new terms. No matter: the mechanisms are stable, and you now hold the method for unfolding any word invented tomorrow.
Key takeaway — Financial jargon is not proof of intelligence: it is compression. Every term folds up a mechanism you can unfold — and a few structuring pairs suffice to decode the essential: level and change (disinflation is not deflation), nominal and real (the statement displays, purchasing power decides), stock and flow (the debt is not the deficit), hawks and doves, normal curve and inverted curve, surprise and consensus. The grammar tying all these words together remains the first chapter's fraction: future income on top, the discount rate below. A word that resists this unfolding says more about the person saying it than about the economy.
The rest of the journey
With this lexicon, the setting-out is complete: you know why macroeconomics steers your investments, at what scale it reasons, which variables populate its dashboard — and you now speak its language. One question remains, which this chapter has brushed twice, with revisions and the phantom technical recession of 2022: where do all these numbers actually come from? Who makes them, out of what, at what rhythm — and how far can they be trusted? That will be the subject of the next chapter, "Where do macro numbers come from? Sources, frequency and reliability": the back kitchen of statistics, without which the best vocabulary in the world would only be commenting on cardboard numbers. Until then, keep the reflex this chapter set out to install: faced with an obscure term, never ask what the word means — ask which mechanism it compresses, and which floor of the fraction it touches.
Sources and further reading
- John Kenneth Galbraith, Money: Whence It Came, Where It Went (1975) — the observation that, in the study of money, complexity is often used to disguise or evade the truth rather than to reveal it.
- George Orwell, "Politics and the English Language," Horizon (1946) — "the great enemy of clear language is insincerity": the founding essay on jargon as a screen.
- Alan Greenspan, remarks before a committee of the U.S. Congress in 1987, as reported by the Wall Street Journal — the quip about learning "to mumble with great incoherence," emblem of Fedspeak.
- Iain Macleod, speech in the British House of Commons, November 17, 1965 (Hansard) — the first recorded occurrence of the word "stagflation," "the worst of both worlds."
- National Bureau of Economic Research (NBER), Business Cycle Dating Committee — the American institutional definition of recession: a significant decline in activity, spread across the economy, lasting more than a few months.
- Alan S. Blinder, "Landings, Soft and Hard: The Federal Reserve, 1965-2022," Journal of Economic Perspectives (2023) — the survey of American monetary tightenings and their rare soft landings, 1994-1995 first among them.
- Philip Cagan, "The Monetary Dynamics of Hyperinflation," in Studies in the Quantity Theory of Money (ed. Milton Friedman, 1956) — the conventional definition of hyperinflation: price rises above 50% per month.
- Arturo Estrella & Frederic S. Mishkin, "Predicting U.S. Recessions: Financial Variables as Leading Indicators," Review of Economics and Statistics (1998) — the slope of the yield curve as a leading indicator of American recessions.
- Irving Fisher, The Theory of Interest (1930) — the founding distinction between nominal and real rates.
- Data for the "level versus change" figure: Bureau of Labor Statistics (consumer price index, series CPIAUCSL), via FRED.