8. The Map of the Journey: From COVID to the Soft Landing (2020-2025)
· Updated on · 18 min read
Two photographs, five and a half years apart. April 2020: the streets of Paris, New York and Milan are empty, half of humanity lives under lockdown, twenty million Americans have just lost their jobs in a single month — and on April 20, Texas crude closes at −$37.63 a barrel: sellers are paying to have their cargoes taken away. December 2025: airports are packed, U.S. unemployment reads 4.4%, inflation 2.7%, the stock market strings together records on the back of artificial intelligence — and central banks are quietly cutting rates, the way you furl a sail after heavy weather.
Between those two images sits the densest macroeconomic episode in half a century: the most brutal and the shortest recession ever measured, the largest peacetime stimulus in history, the first inflation flare-up in forty years, the fastest monetary tightening since Volcker, a year in which stocks and bonds sank together, a banking crisis settled over a weekend — and, at the end of it, the soft landing that almost nobody believed possible. This chapter, the last of the setting-out module, tells the journey in one piece — the seven before it brushed against it only in fragments. Here is the whole map, where the chapters ahead will come for their examples.
One precaution before setting off. This story is not a scale model of a "normal cycle": these years were atypical, and several supposedly infallible indicators got them wrong. It is a training ground: five years that contain, at high speed, nearly everything an investor's lifetime can throw at you.
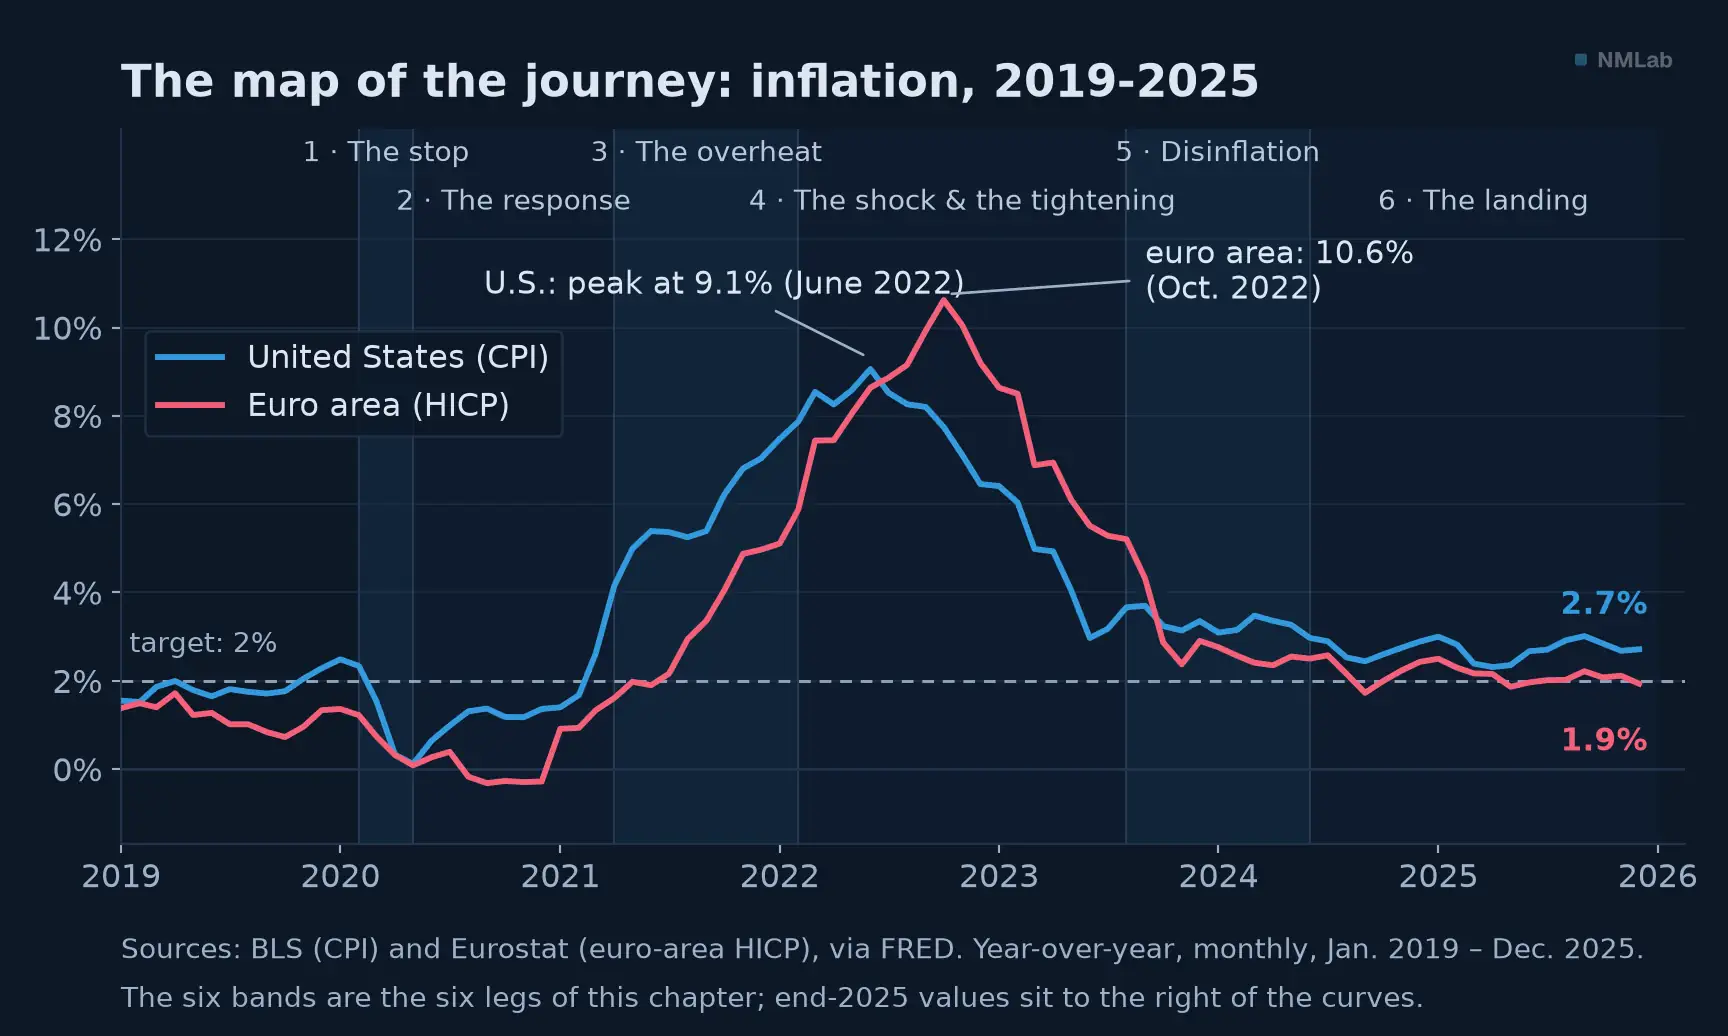
The whole map: year-over-year inflation in six legs — one per section of the chapter.

At a glance — Level: Intermediate · Prerequisites: chapters 1 to 7 of this module
By the end of this chapter, you will be able to:
- tell in one continuous story the five years that serve as the training ground for this whole journey;
- explain why markets turned a year before the economy did, in March 2020;
- see why the most celebrated indicators — the inverted curve, the Sahm rule — got it wrong.
Leg 1 — The great stop (February-April 2020)
The crisis does not come from the economy: it comes from a virus, and even more from the response to the virus. On March 11, 2020, the WHO declares a pandemic; within weeks, governments deliberately shut down whole sections of their economies. The great recessions used to be born of financial excess or oil shocks; this one is a stop by decree, an economy placed in an induced coma. The IMF names it "the Great Lockdown" — the worst contraction since the Great Depression.
By mid-2020, U.S. GDP stands about 9% below its end-2019 level — the second quarter alone is announced, in the middle of the storm, at around −33% annualized (today's data say −28%: remember chapter 6 on revisions). The euro area, under stricter lockdowns, loses 14%. In April, America destroys more than twenty million jobs — a decade of job creation erased in one month — and unemployment leaps from 3.5% to 14.8%, a record for the postwar series — 14.7% in the figure published at the time, the one chapter 6 quotes, revised up since: even a record changes decimal. Europe chooses short-time work instead: the state pays to freeze employment contracts, and unemployment does not explode — firing fast versus hibernating, a lasting divergence.
Markets live through a complete crisis in one month. The S&P 500 loses 34% between February 19 and March 23, the fastest descent into a bear market in its history; the VIX, the volatility index, closes above even its 2008 records. Above all, the panic reaches the supposedly absolute shelter: in mid-March, Treasuries and gold fall at the same time as stocks. When liquidity runs out, you don't sell what you want to, you sell what you can — remember that crisis reflex, the "dash for cash." Then the unthinkable of April 20: tanks full, WTI settles at −$37.63 — supply and demand pushed to the end of their logic.
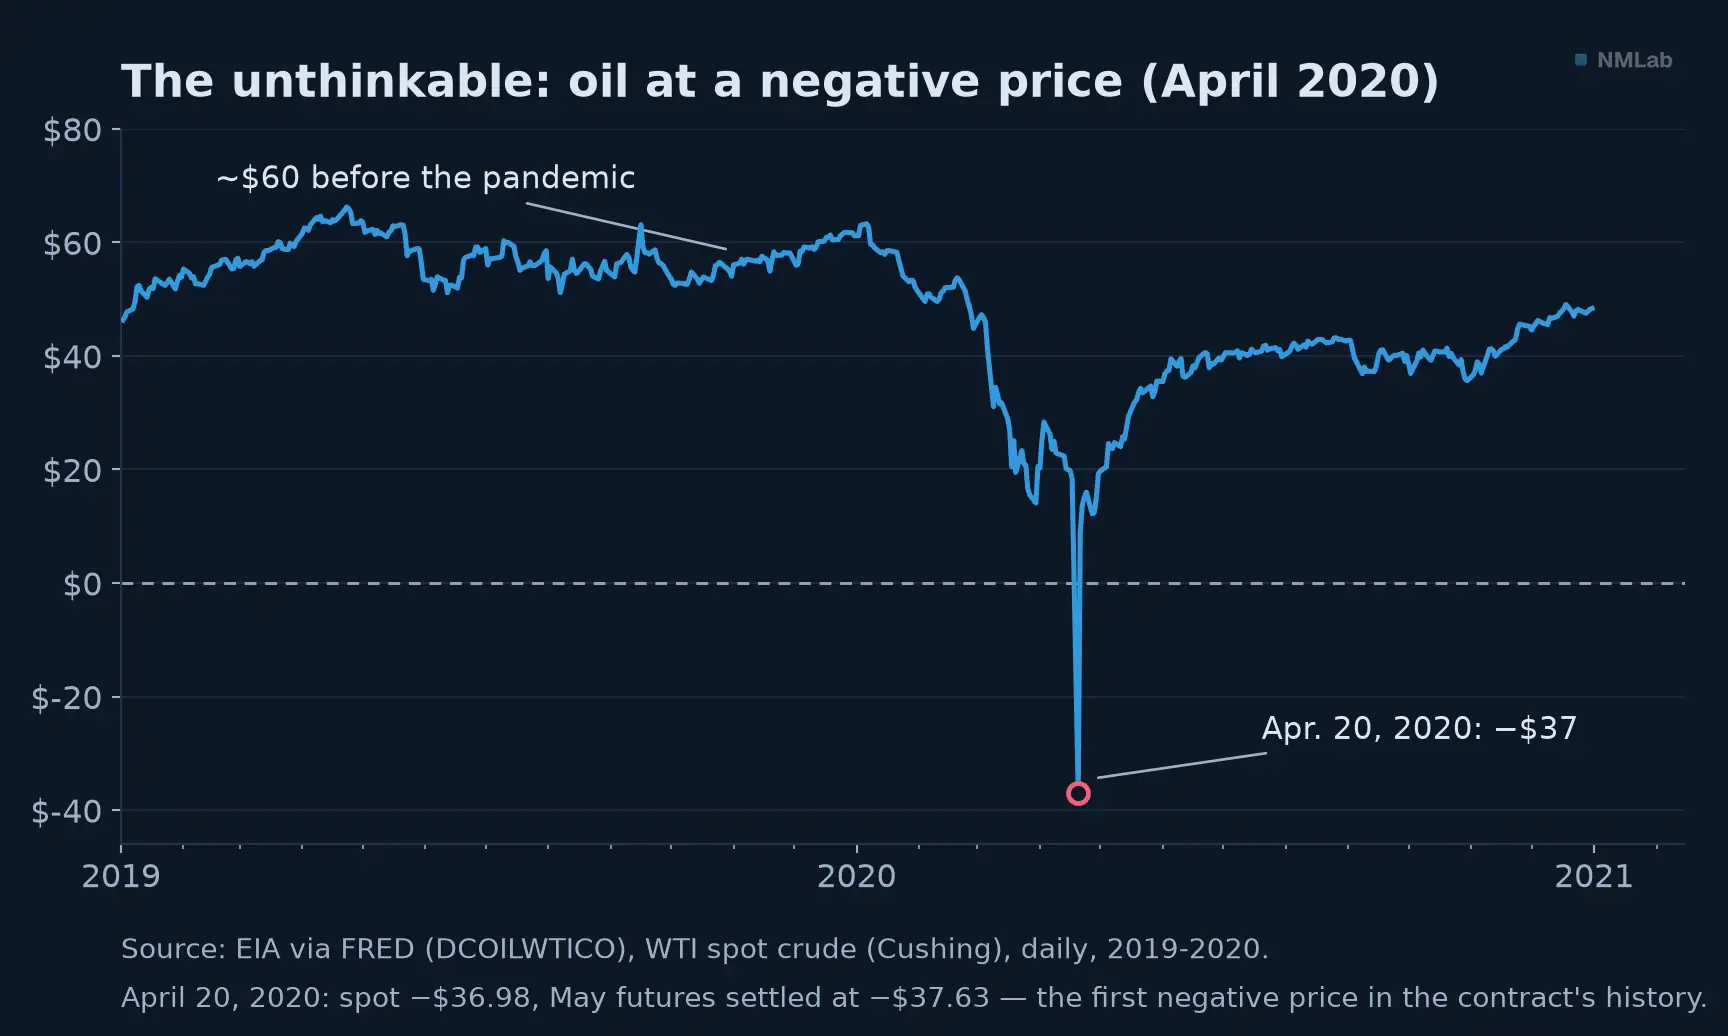
The symbol of the stop: nobody needs oil anymore, the price turns negative — a first since the contract was created, in 1983.
The NBER, the official referee of U.S. cycles met in chapter 5, will date the recession from February to April 2020: two months, the shortest in more than a century and a half of archives. A wartime fall, a thunderstorm's duration.
Leg 2 — The response: "whatever it takes," planetary edition (2020-2021)
The response was more unprecedented still — and it is the response that begets everything after. Central banks fire first: the Federal Reserve takes rates to 0-0.25% in two emergency meetings (March 3 and 15), then announces on March 23 asset purchases without limit, venturing for the first time into corporate debt; its balance sheet swells by some 2.2 trillion, the largest support package in its history —, followed by two more; Europe funds short-time work, and the Twenty-Seven borrow massively in common for the first time — the €750 billion NextGenerationEU plan. Never had monetary and fiscal policy pushed together so hard, so fast.
On March 23, 2020, the very day the Fed announces "without limit," the S&P 500 hits bottom and turns around. The economy will take a year to regain its level. Chapter 2 warned you — markets do not wait for the data, they anticipate: here is the purest example of the decade. The year of the worst peacetime recession thus ends... up: +16% for the S&P 500, +44% for the Nasdaq. If that sentence still shocks, reread chapter 1's fraction: future income believed saved in the numerator, a discount rate cut to zero in the denominator.
One last anomaly, heavy with consequences: during the worst modern recession, American household income rises. Federal checks, boosted benefits, forbidden spending: savings pile up, more than $2 trillion of "excess savings" by the Fed's estimates. Keep the image of a compressed spring: demand intact and funded, facing a supply still shut.
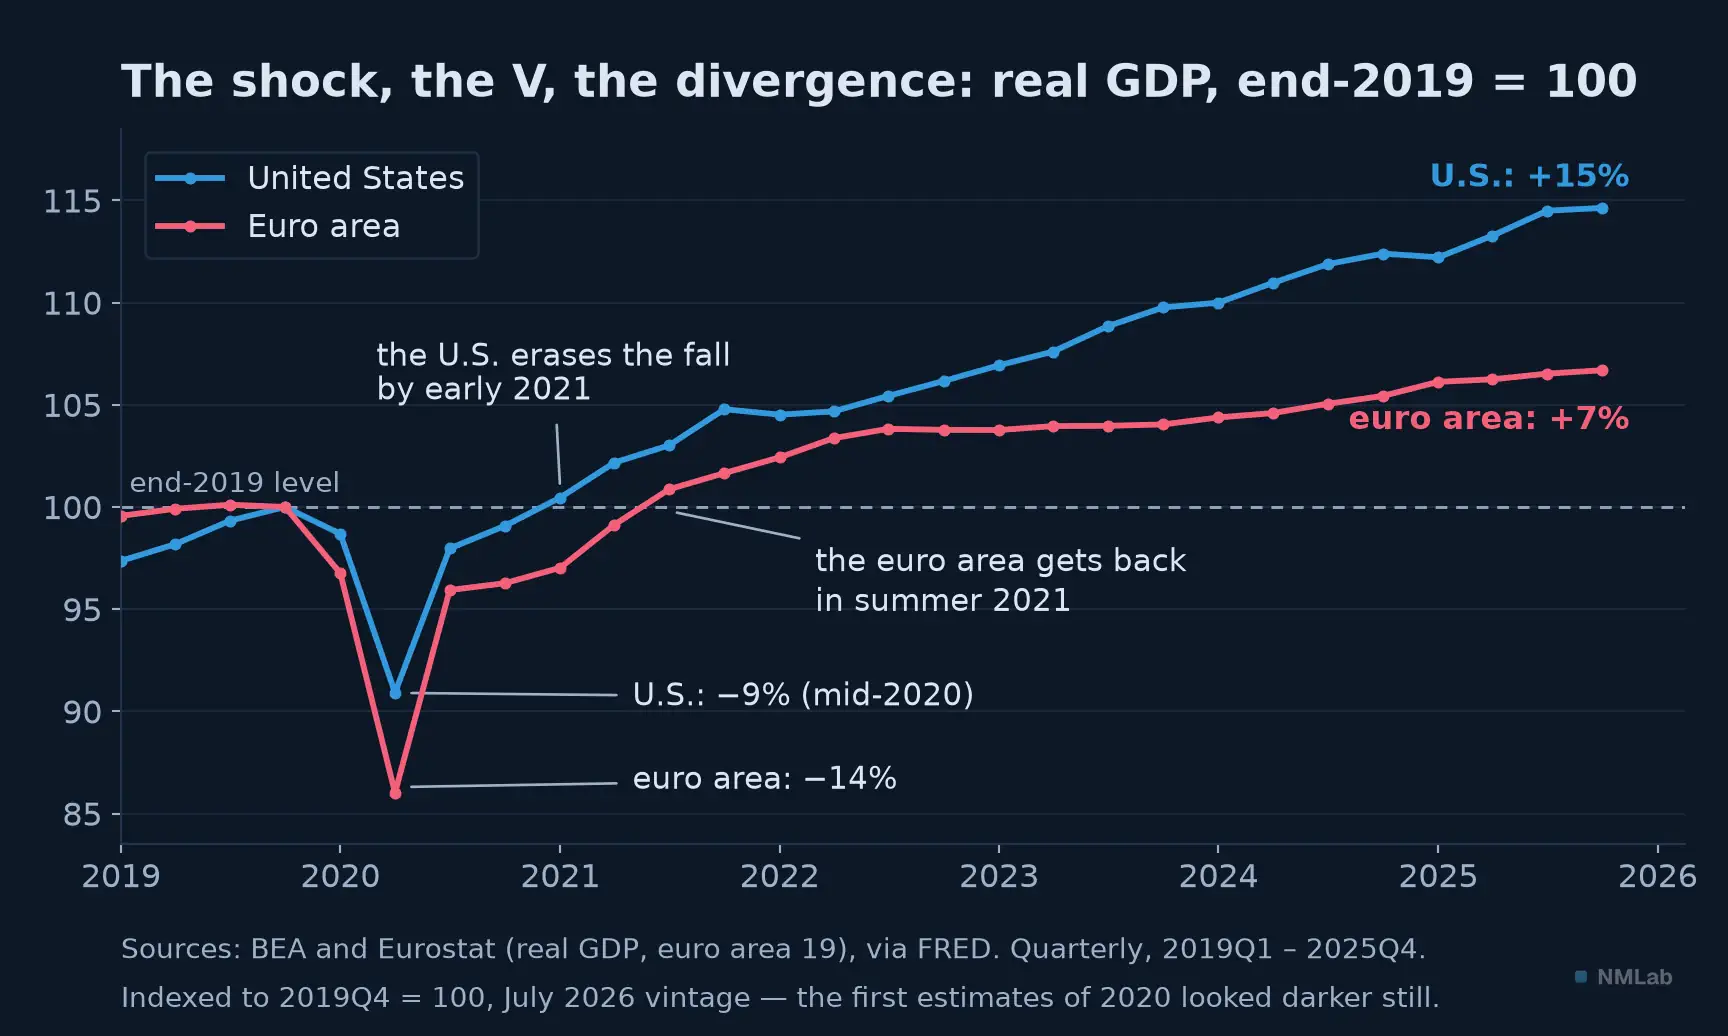
Crash, rebound, divergence: at end-2025, America stands 15% above its pre-COVID level, the euro area 7%.
Leg 3 — The overheat: inflation settles in (2021 - early 2022)
The spring releases in the spring of 2021, when vaccines reopen economies — and it releases crooked. Demand comes back all at once, but tilted toward goods: you cannot catch up on two years of restaurants, so you buy bikes, screens, furniture. Opposite it, a global supply side built for just-in-time saturates: semiconductors run so short that car assembly lines stop, the container ship Ever Given plugs Suez for six days in March 2021, and the price of a container is multiplied by seven to ten depending on the route. Shortages plus doped demand: the textbook inflationary cocktail.
The first serious alarm rings on May 12, 2021: the April U.S. CPI comes in at 4.2%, far above consensus — used cars alone are up 21% year over year. Chapter 4's reflex: it is not the level that strikes markets, it is the gap to consensus. Central banks and economists see a passing traffic jam — the official word is "transitory" — and the Fed's December 2020 projections envisaged no rate hike before the end of 2023. Month after month, the transitory digs in: 7.0% in December 2021 in the United States, unseen since 1982; 5.0% in the euro area, a record in the euro's young history. On November 30, 2021, before the Senate, Jerome Powell capitulates on the vocabulary: it is "probably a good time to retire that word."
Why the blindness? Not stupidity. A decade of missing inflation had convinced nearly everyone that prices no longer ran away in rich countries; the new regime was read with the old regime's glasses. The reference autopsy, by Bernanke and Blanchard, would later settle it: the spark did come from the shocks — energy, shortages, the tilt toward goods —, but it landed on a labor market white-hot from the stimulus, with up to two job openings per unemployed person. A supply shock at the ignition, excess demand in the sustain: each school held its half of the truth.
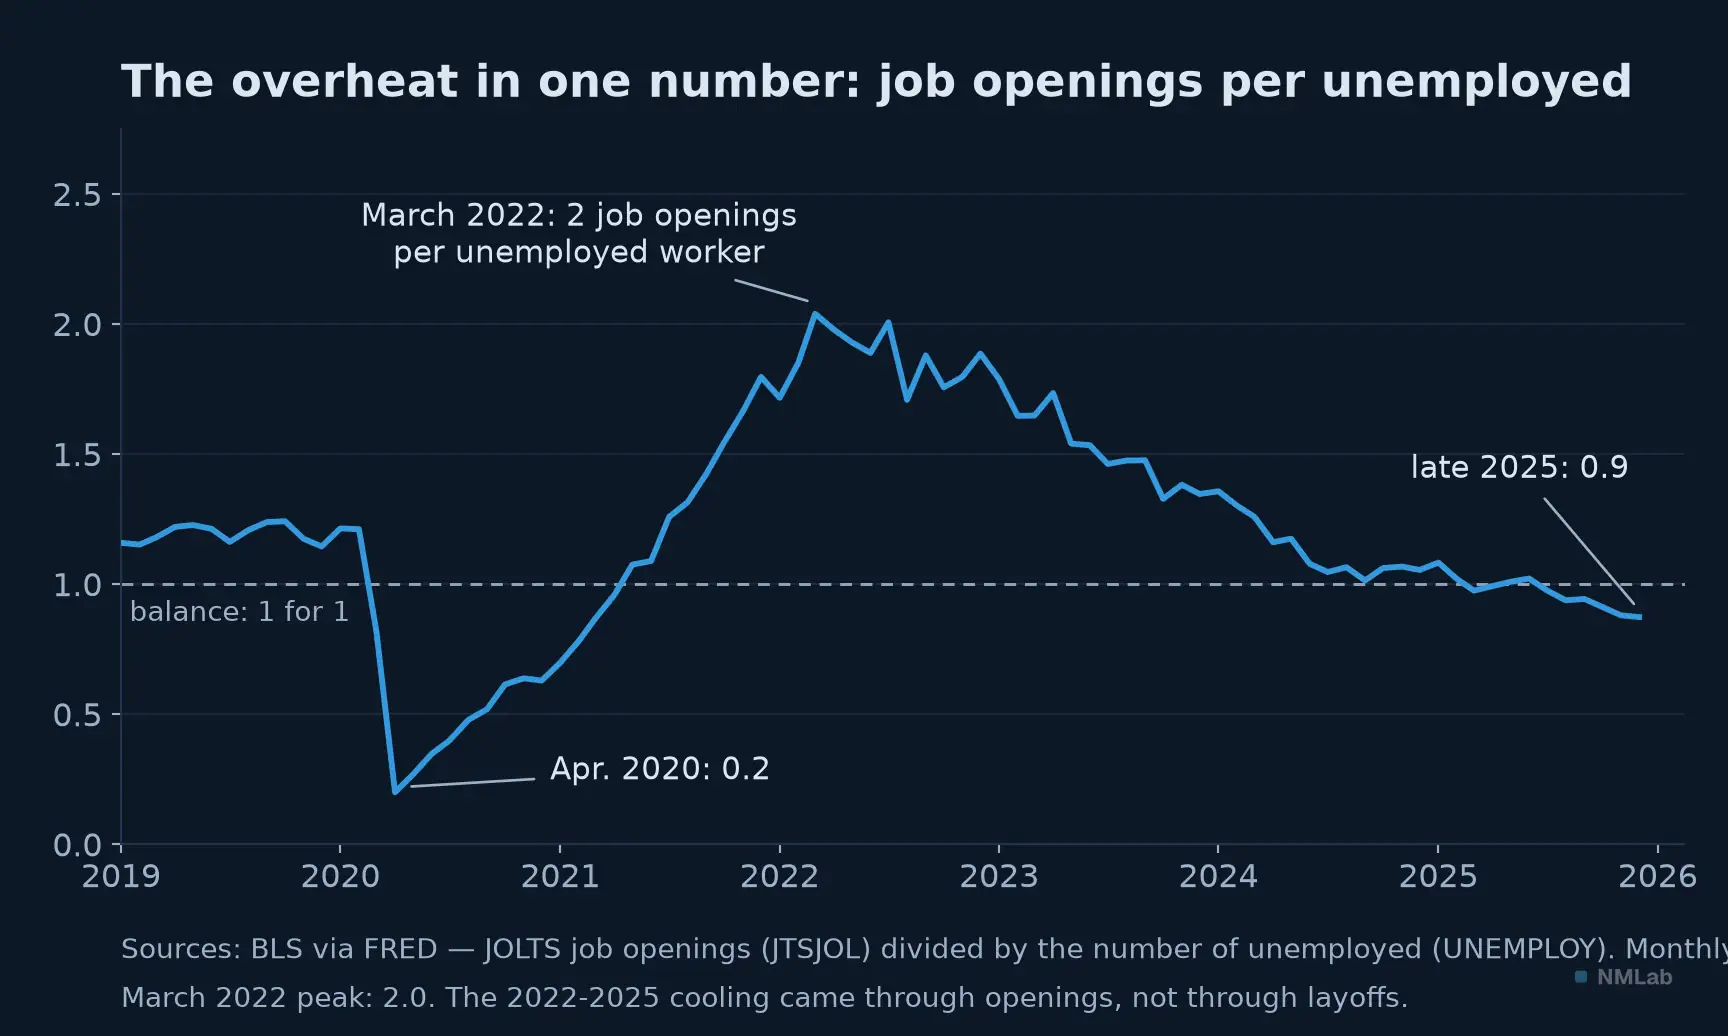
The overheat in one number: two job openings per unemployed worker in early 2022 — then a cooling that came through openings, not layoffs.
Leg 4 — The shock and the great tightening (2022 - summer 2023)
On February 24, 2022, Russia invades Ukraine, and the supply shock changes dimension. Europe, moored to Russian gas, watches the megawatt-hour price rise roughly tenfold to nearly €340 at the August 2022 peak, while Brent briefly tops $130. Inflation crests: 9.1% in June 2022 in the United States, the highest since 1981; 10.6% in October in the euro area, an absolute record for the series; 11.1% in the United Kingdom. With the target missed by five to eight points, central banks launch the fastest tightening since Paul Volcker. The Fed starts from zero in March 2022 and chains the hikes — including four consecutive 75-basis-point moves — up to 5.25-5.50% in July 2023: +525 basis points in sixteen months. The ECB, which had not raised rates since 2011, exits eight years of negative rates in July 2022 and lifts its deposit rate from −0.50% to 4.00% in fourteen months. Even the pump runs in reverse: asset purchases become quantitative tightening. Gravity, as the panorama said quoting Buffett, was back.
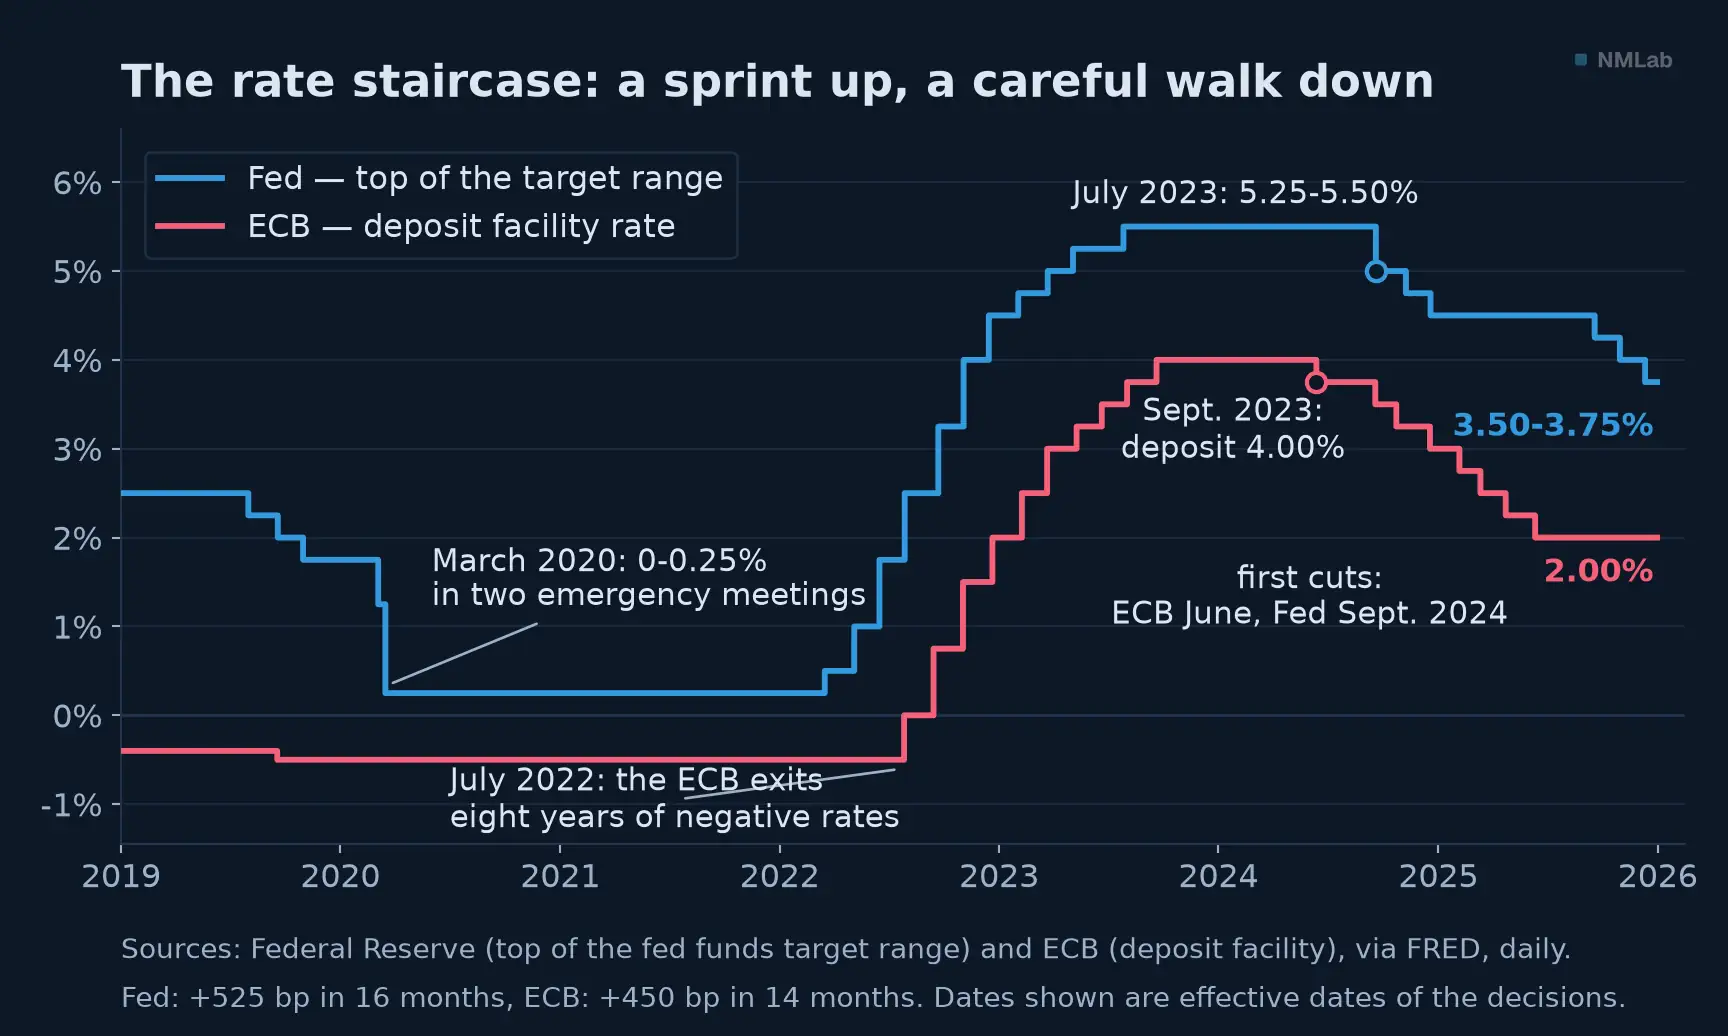
A sprint up, a careful walk down: +525 basis points in sixteen months for the Fed, +450 in fourteen for the ECB — the circles mark the first cuts of 2024.
For portfolios, 2022 is the year the manuals burn. The rise in rates strikes the denominator: stocks fall (−19% for the S&P 500, −33% for the Nasdaq). But bonds, supposed to cushion, fall too: the U.S. 10-year yield goes from 1.5% to above 4%, and the benchmark U.S. bond index signs, at −13%, the worst year in its history. Stocks and bonds in the red together: the balanced "60/40" portfolio lives its worst year since the Great Depression. A guardrail to remember: bond diversification protects in demand recessions, not in inflation shocks. The dollar, refuge and yield at once, crushes everything — the euro drops below parity for the first time in twenty years.
Speed first breaks what had been built on free money. September 2022: an unfunded budget plan sinks British government bonds, trapping pension funds in a spiral of forced selling; the Bank of England buys gilts in emergency, and Prime Minister Liz Truss is out of office after forty-nine days — the bond market can fire a leader. March 2023, the wave reaches the banks: Silicon Valley Bank, stuffed with bonds bought at the top and with flighty deposits, collapses in two days; on March 19, Credit Suisse, 167 years old, is sold to UBS over a weekend. The most instructive part is the answer: the Fed opens a lending facility to put out the banking fire… and raises rates the same month. Two missions, two tools — financial stability has its facilities, inflation has the rates. Contagion stops there; 2008 does not replay.
Meanwhile, an oracle lights up: since the summer of 2022, the U.S. yield curve has been inverted — the 10-year below the 2-year, on a scale unseen since 1981. The indicator that had preceded every modern recession announces the next one; by late 2022, the 2023 American recession becomes the most consensual ever forecast — a Bloomberg Economics model displays a "100% probability."
Leg 5 — The disinflation nobody expected (2023 - mid-2024)
2023 refuses the script. Instead of the recession: +2.9% U.S. growth, unemployment at 3.4% in the spring — the lowest since 1969 —, a third quarter announced at nearly 5% annualized. And yet inflation falls: from 9.1% to 3.0% in one year in the United States; the euro area follows, from 10.6% to below 3% by late 2023. Massive disinflation without a recession or a wave of layoffs — commentators, incredulous, speak of "immaculate disinflation."
The explanation comes in four pieces. One: half the problem was supply — chains repaired, freight ordinary again, European gas back under €40; what the shock had pushed up, its disappearance brings back down, at no social cost. Two: the labor market loosened where nobody was looking — job openings, down from about twelve million to eight, rather than jobs. Three: monetary transmission was muffled — American households locked into thirty-year fixed rates around 3%, companies refinanced at length in 2020-2021: the Fed's hikes hit mostly new borrowers. Four: labor supply reflated — returns from inactivity, immigration —, easing wages without layoffs. The U.S. economy was simply better insulated from rates than in 1980.
Europe, for its part, pays full price for the gas: Germany contracts slightly in 2023, the euro area stalls — no collapse, but two blank years while America accelerates; the divergence of the GDP figure deepens right there. China, out of zero-COVID abruptly at the end of 2022, disappoints: a property crisis, cautious households, prices flirting with deflation — the great absentee of the global recovery. Markets, meanwhile, change heroes: ChatGPT appears in late November 2022, and 2023 becomes the year of artificial intelligence — Nvidia soars 239%, a handful of megacaps drives most of the S&P 500's gain. In the autumn of 2023, one last spasm: the U.S. 10-year brushes 5%, a sixteen-year high, on the theme of "higher for longer" — then, in December, the Fed hints at cuts, and everything turns.
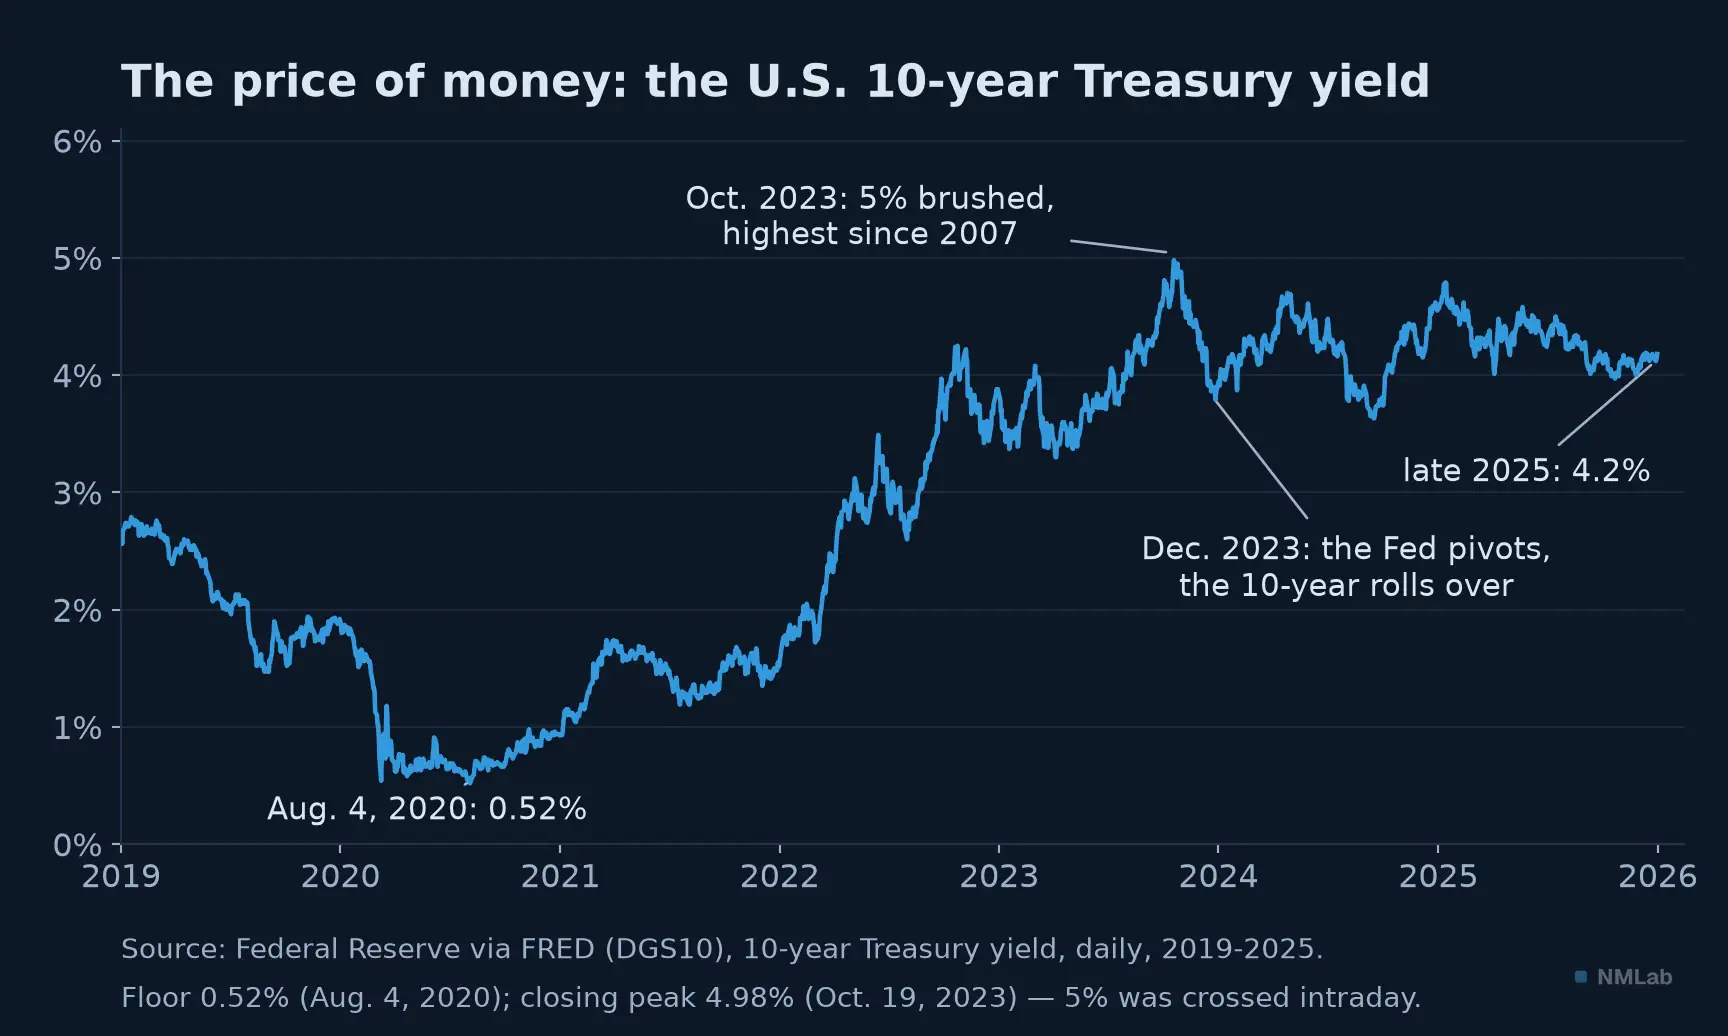
From 0.5% in the summer of 2020 to 5% brushed in October 2023: the price of money woke up.
Leg 6 — The landing, more or less (mid-2024 - 2025)
Bringing inflation back to target without causing a recession: the textbooks make it a definition, history makes it an exception. Alan Blinder, who dissected eleven Fed tightenings since 1965, counts only a handful as roughly successful — and a single perfect one, in 1994-1995. That is how rare what begins in 2024 is: inflation converges — the euro area even dips briefly below 2% in September —, and the relay of cuts starts. The Swiss National Bank opens in March; the ECB follows in June, before the Fed, a first for it; the Fed joins in September, with 50 basis points straight away.
There remains the alarm of summer 2024. In early August, a disappointing jobs report — unemployment at 4.3% in the estimate of the day — trips the Sahm rule, the signal that had flagged every U.S. recession since 1970 without fail; three days later, a Japanese rate hike unwinds yen-funded bets in cascade, and the Nikkei plunges 12% in a single session, its worst since 1987. Three weeks later, it has all closed up: no recession. Claudia Sahm herself would explain why her rule was overreacting to unemployment swollen by labor-force inflows rather than by layoffs. Do the tally with leg 4: a record curve inversion — no recession; the Sahm rule tripped — no recession. No indicator, however glorious, replaces the weight of evidence.
2025 adds the final twist: trade policy. On April 2 — "Liberation Day" —, the new U.S. administration announces across-the-board tariffs; within a week the S&P 500 loses about 12% and the VIX tops 50, before a 90-day pause and then a truce with China close the fever. What remains is the essential: the average effective U.S. tariff climbs toward 15 to 18% by most estimates — a level out of the 1930s. Watch both needles. U.S. inflation, which had been closing on the target, sticks back near 3%; employment, meanwhile, cools sharply — hiring nearly frozen, unemployment at 4.4%, and an annual benchmark revision that erases 911,000 jobs with a stroke of the pen (chapter 6). Caught between tariff-pushed prices and a fraying labor market, the Fed waits nine months then sides with employment: three cuts in the autumn, down to 3.50-3.75% in December — in the middle of a record 43-day government shutdown that suspends federal statistics, October CPI included. The ECB, for its part, finished its descent in June 2025, at 2.00%: mission accomplished on the euro side.
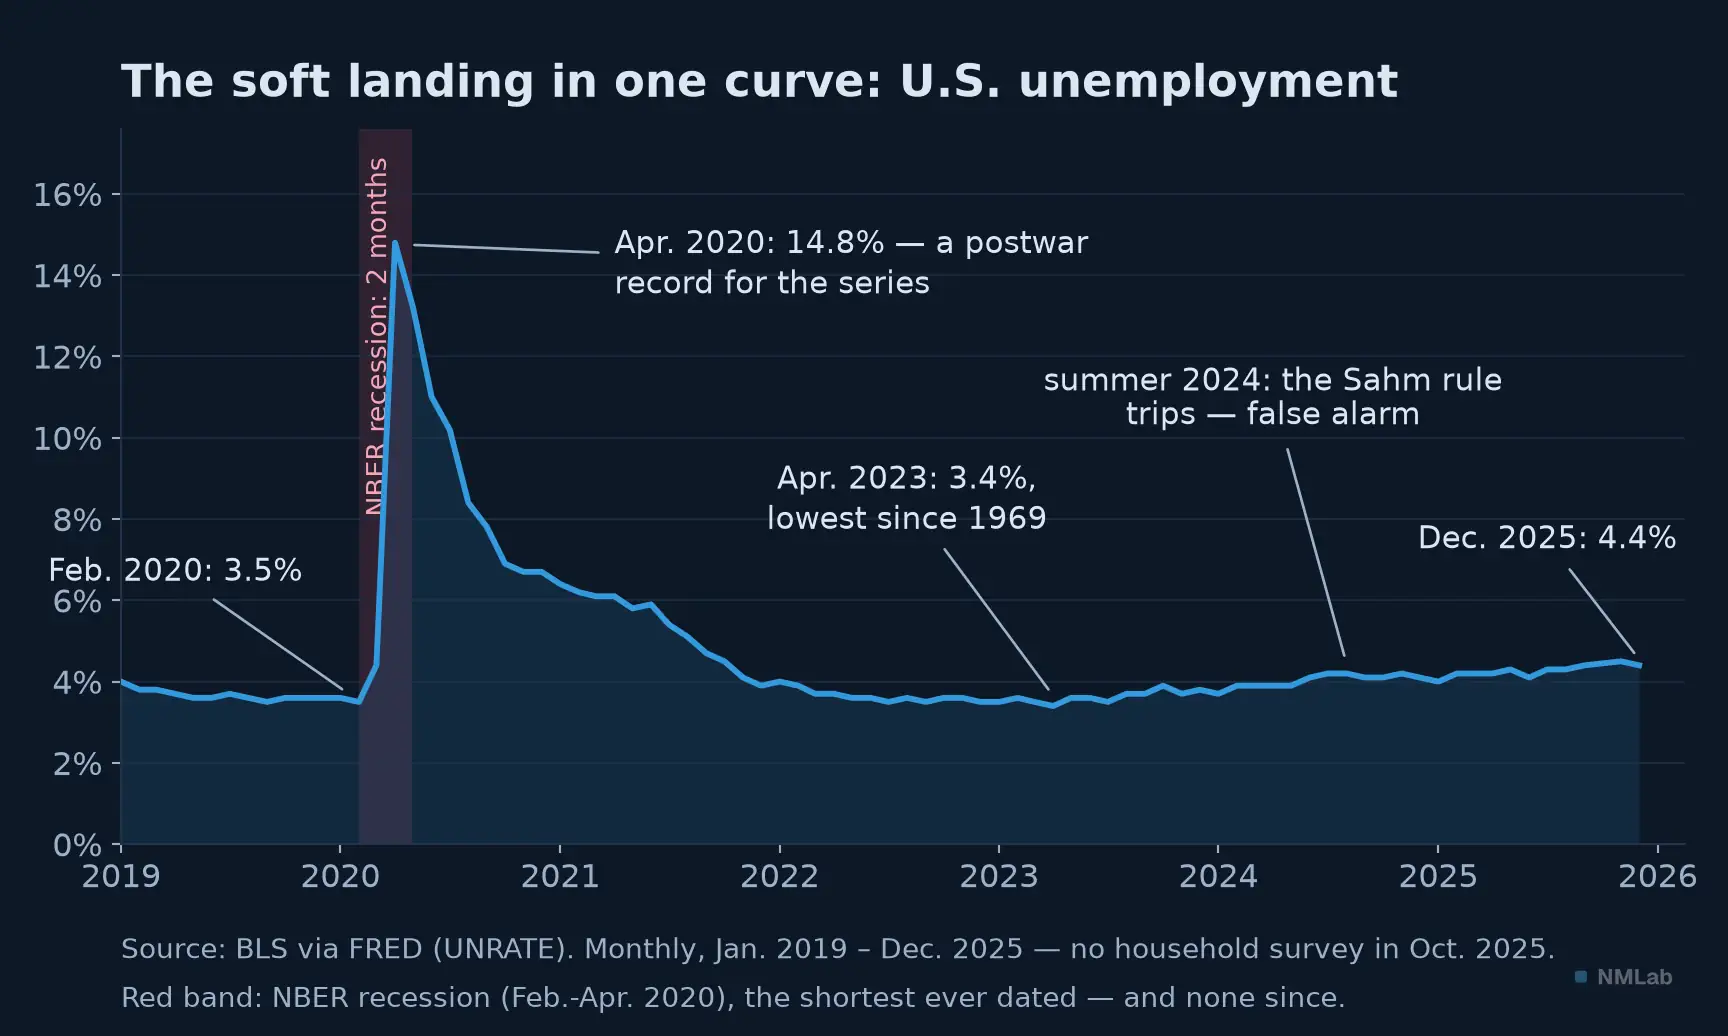
A record spike, the lowest since 1969, a gentle drift upward with no recession: if the soft landing has a face, it is this curve.
So, the balance sheet of the journey? By the textbook definition: a success. World inflation came back from 9-10% to 2-3% with no U.S. recession and no unemployment explosion. But the picture has its shadows. Prices did not fall: the U.S. price level remains about 26% above end-2019 (23% in the euro area), and that gulf between the change that slows and the level that stays — chapter 5 — fed a worldwide electoral anger: 2024 will be remembered as a black year for incumbents, everywhere. The American economy ends 15% above its pre-COVID level, the euro area 7%: a symmetric shock left an asymmetric world. And the U.S. labor market of late 2025 — little hiring, little firing, unemployment creeping up — is a reminder that a landing is never a full stop: the map ends here, not the journey.
What the map teaches: five lessons
One — markets live six months ahead. The stock market bottomed on March 23, 2020, the day of "without limit," a year before the economy healed; it fell through 2022 while growth held, because indices were discounting the new world of rates. Do not ask an index how the economy is doing: ask it what it anticipates — that is chapter 1's fraction at work.
Two — the change heals, the level stays. Disinflation is not deflation: 2025 prices remain a quarter above those of 2019. GDP landed softly; the till receipt did not — and voters vote on the till receipt. That is chapter 5's level-versus-change pair, turned into political history.
Three — the regime commands correlations. In a demand shock, bonds cushion stocks; in an inflation shock, they fall with them — 2022 branded it in. Before counting on any diversification, ask in which regime it earned its stripes: that is chapter 4's regime reflex.
Four — oracles die too. The "transitory" of 2021, the "certain" recession of 2023, the longest curve inversion of the modern era without a recession, the Sahm rule's false alarm, the technical recession of 2022 erased from the data by revisions: in five years, every certainty broke at least once. Chapter 6's weight of evidence and chapter 2's humility are not courtesies — they are survival equipment.
Five — everything is faster: prepare, don't predict. A two-month recession, a five-week crash, a weekend banking crisis, a tariff shock closed within a month: information travels in seconds and the authorities have well-drilled playbooks — panic windows keep getting shorter. You will never be faster than the machines; you can be better prepared. That is chapter 7's routine, pre-written tripwires included.
Key takeaway
- Five years, a full cycle at high speed — A deliberate stop (a two-month recession, the shortest ever dated), an unprecedented monetary-plus-fiscal response, an overheat ("transitory" at 9.1% and 10.6%), the fastest tightening since Volcker (+525 basis points in sixteen months), disinflation without recession, then rate cuts. A wartime fall, a thunderstorm's duration.
- The landing, more or less — The textbooks make it a definition, history makes it an exception; this one stays imperfect: prices a quarter higher than before, Europe left behind, a cooling labor market. GDP landed softly; the till receipt did not.
- Markets anticipate, the regime commands correlations — Indices turned a year before the economy did. And bonds cushion demand shocks, not inflation shocks: 2022 branded it in.
- Oracles die too — A record curve inversion with no recession, the Sahm rule's false alarm, "2023 refuses the script": every certainty broke. These five years stay atypical: a training ground, not a normal cycle. Prepare, don't predict.
The rest of the journey
Module 1 closes on this map: you know why macro steers your investments, with which variables, which language, which numbers — and on what terrain you will train. Module 2 opens the first brick in depth: growth. Next chapter: "Understanding GDP: the measure of the wealth a country produces" — the quantity the running thread saw plunge and come back. Until then, pin the map to the wall: six legs, five lessons — and remember that those who promised to predict this journey were wrong at every turn; those who had prepared came through it.
Sources and further reading
- NBER, Business Cycle Dating Committee, announcement of July 19, 2021 — the February-April 2020 recession: two months, the shortest on record (records back to 1854).
- IMF, World Economic Outlook, April 2020 — "The Great Lockdown," the worst contraction since the Great Depression.
- Federal Reserve, statement of March 23, 2020 — purchases "in the amounts needed" and the first facilities aimed at corporate debt.
- Jerome Powell, testimony before the Senate Banking Committee, November 30, 2021 — retiring the word "transitory."
- Ben Bernanke & Olivier Blanchard, "What Caused the U.S. Pandemic-Era Inflation?", Hutchins Center (Brookings), 2023 — supply shocks at the ignition, an overheated labor market in the sustain.
- Alan Blinder, "Landings, Soft and Hard: The Federal Reserve, 1965-2022," Journal of Economic Perspectives, 2023 — eleven tightenings, one perfect landing (1994-1995).
- Claudia Sahm, "Direct Stimulus Payments to Individuals," in Recession Ready (Hamilton Project, 2019) — the Sahm rule; and her summer-2024 analyses of the false alarm.
- Bank of England, statement of September 28, 2022 — emergency gilt purchases against the pension-fund (LDI) spiral.
- Bloomberg Economics, October 2022 — the model's twelve-month U.S. recession probability raised to 100%.
- Figure data: BLS (CPI CPIAUCNS, unemployment UNRATE, openings JTSJOL/UNEMPLOY), BEA (GDP GDPC1), Eurostat (HICP CP0000EZ19M086NEST, GDP CLVMNACSCAB1GQEA19), Federal Reserve (DFEDTARU, DGS10), ECB (ECBDFR) and EIA (WTI DCOILWTICO), via FRED — vintage of July 3, 2026.