9. Understanding GDP: The Measure of the Wealth a Country Produces
· Updated on · 18 min read
Washington, January 4, 1934. A thirty-two-year-old economist, Simon Kuznets, delivers to the United States Senate a report commissioned a year and a half earlier, in the trough of the Great Depression: National Income, 1929-1932. For the first time, a major country holds an overall measure of what it produces — and the verdict fits in one line: between 1929 and 1932, the national income of the United States was roughly cut in half. The crisis was four years old; you could read it in the soup kitchens, the stock indices, the freight-car loadings. Until then, nobody could say how much poorer the country had become.
That missing number changed economic policy: the U.S. Department of Commerce would later call the national accounts "one of the great inventions of the 20th century," and Kuznets would receive the Nobel Prize in 1971. A century on, his invention is everywhere. Gross domestic product — the value of everything a country produces in goods and services over a period — reads $30,762 billion for the United States of 2025. It is the yardstick for debts, deficits and capitalizations; it is what decides that a recession happened. Three letters that became the unit of account of all of macroeconomics.
This chapter opens module 2, and the first brick of the dashboard: activity. You have already seen GDP at work — it is what plunges at a −28% annualized pace in the spring of 2020 on chapter 8's map. Time to open it like a watch: what it counts, how it is added up, how to read it without being trapped — and what to expect from it, or not, for your investments.
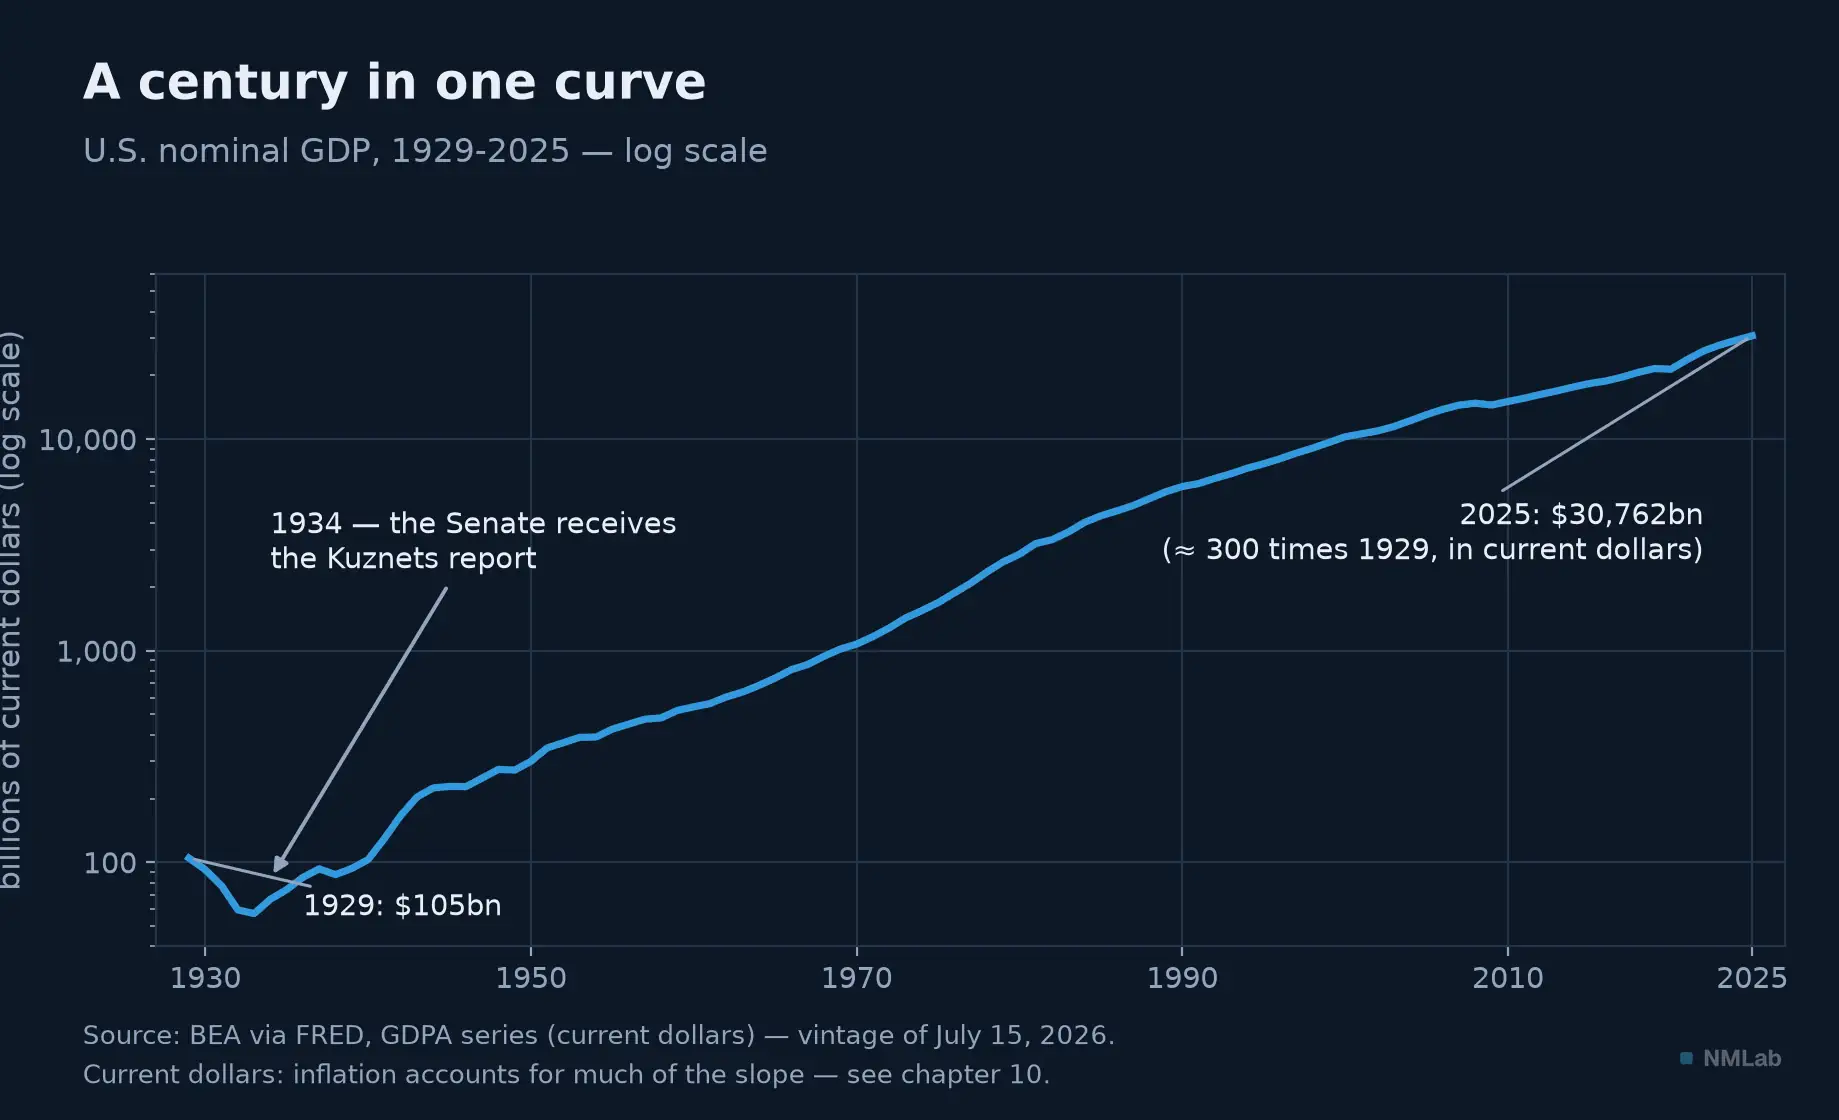
A century of the series Kuznets inaugurated: multiplied by nearly 300 — in current dollars, inflation included.

At a glance — Level: Foundations · Prerequisites: chapter 5
By the end of this chapter, you will be able to:
- say what GDP counts, what it ignores, and by which three roads it is added up;
- read C + I + G + (X − M) without falling for the imports fallacy;
- check the display convention before reacting to any growth number.
Value added: counting without double-counting
The definition fits in one sentence: GDP is the market value of all final goods and services produced within a country during a given period. Every word earns its keep. "Market value": we add up prices, the only common language between a baguette and a piece of software. "Produced": GDP measures production, not transactions — reselling a 1980s house adds nothing (the real-estate agent's commission, a genuine service, does). "During a period": it is a flow, in the sense of chapter 5 — the river's flow, not the size of the lake.
Which leaves the decisive word: "final." Follow a baguette. The farmer sells his wheat to the miller for €0.20; the miller sells his flour to the baker for €0.60; the baker sells his baguette for €1.50. Adding the three sales would give €2.30 — the wheat counted three times, the flour twice. National accountants only add each stage's value added: what it sells, minus what it bought from the stages before. 0.20 + 0.40 + 0.90 = €1.50: exactly the price of the final product. GDP is the sum of value added — which makes it indifferent to the length of production chains.
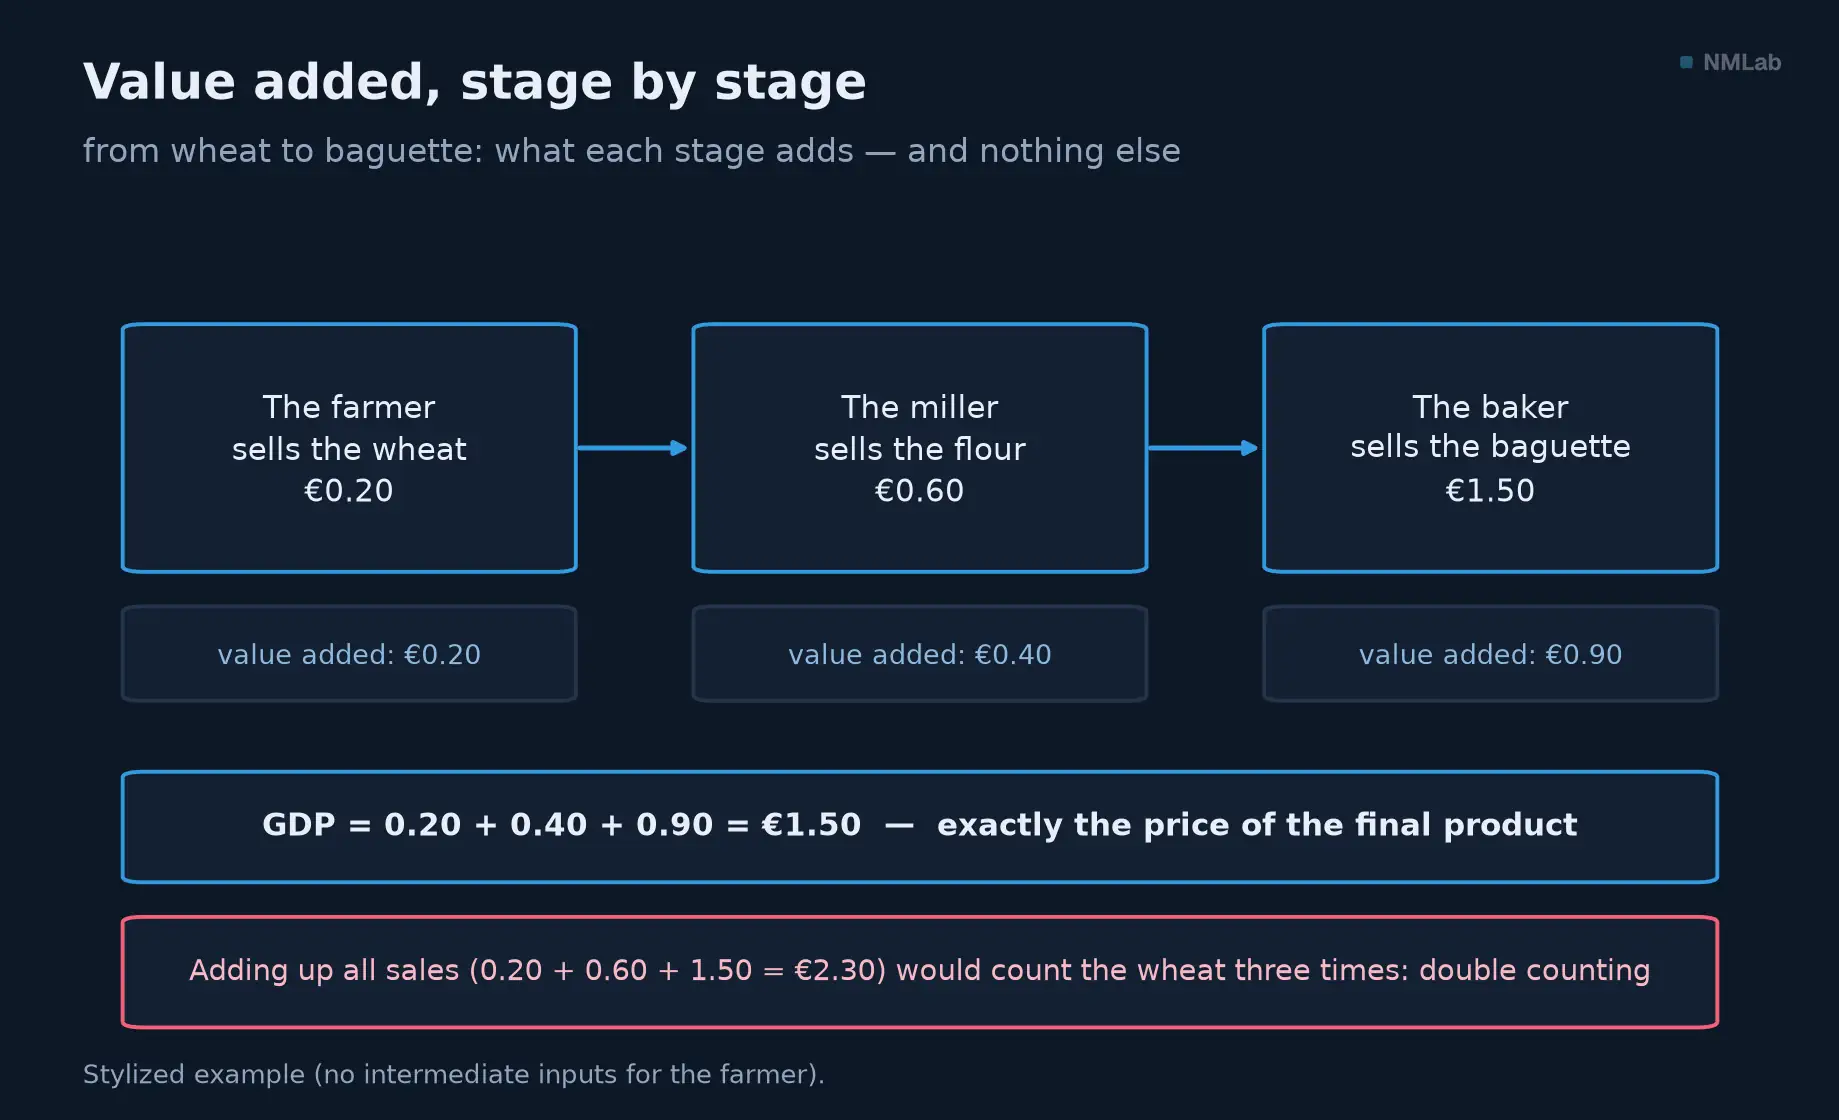
GDP only adds what each stage contributes: counting every sale would count the wheat three times.
The acronym's other letters deserve a stop. "Domestic": what is produced on the territory is counted, whoever owns it — the German plant in South Carolina makes American GDP. Its cousin, gross national income, counts the reverse: what accrues to residents, wherever it is produced. The nuance sounds byzantine; Ireland makes it spectacular: multinationals domicile so many assets there that its 2015 GDP "grew" 26% in a single revision — Paul Krugman called it leprechaun economics. "Gross," finally: the wear of machines and buildings is not deducted — the account stops before depreciation.
One last subtlety: the boundary. GDP includes production that nothing invoices — public services, counted at cost; imputed rents, the fictitious rent owner-occupiers "pay themselves" for living in their own homes. It excludes housework and volunteering. Where exactly the line runs: a whole section returns to it below.
Three roads to the same total
How do you add up "everything a country produces"? By three roads, and the genius of national accounting is that they lead to the same summit. Take the baguette again, and follow it three times.
First road, output: the baker, the miller and the farmer added €0.90, €0.40 and €0.20 of value. Total: €1.50. Second road, expenditure: someone bought that baguette for €1.50. Third road, income: that €1.50 did not vanish — it split into wages for the baker and his apprentice, profit for the bakery, income for the farmer, taxes. Total: €1.50. Three counts, three paths, the same euro and a half.
This is no coincidence, it is an identity — and it holds for two stubborn reasons. The first: everything sold pays someone. A sale price decomposes entirely into purchases from suppliers (already counted one stage down) and incomes paid out. There is no third destination: the euro paid ends up in somebody's pocket. The second reason is craftier: everything produced is bought. What about the unsold? National accountants settled the question with an elegant convention: a baguette that finds no taker is deemed bought by the baker himself, as inventory. That is exactly the change in inventories you will find lodged inside the investment block of the formula below. Thanks to that trick, no production is ever left orphaned: output = expenditure by construction.
Scale it up — the baguette becomes a country, each road an aggregate. Output: the sum of value added, plus taxes on products net of subsidies. Expenditure: households, firms, government, the rest of the world. Income: wages, profits, income from self-employment, net taxes. Three independent measures of the same object, checking one another — that is what makes national accounts robust.
Because "the same total" holds in theory. In practice, each road leans on its own sources — sales surveys here, tax returns there — and they never land on exactly the same number. The statistical discrepancy between expenditure-side GDP and its income-side twin (America's gross domestic income) keeps the trace: usually tiny, it widened to 2.5% by late 2023, unseen in thirty years, before revisions pulled the two stories back together. When the three roads diverge, it is not the accounting that is wrong: it is that one of the maps was badly surveyed. Remember chapter 6 — a macro number is an estimate, not a weighing.
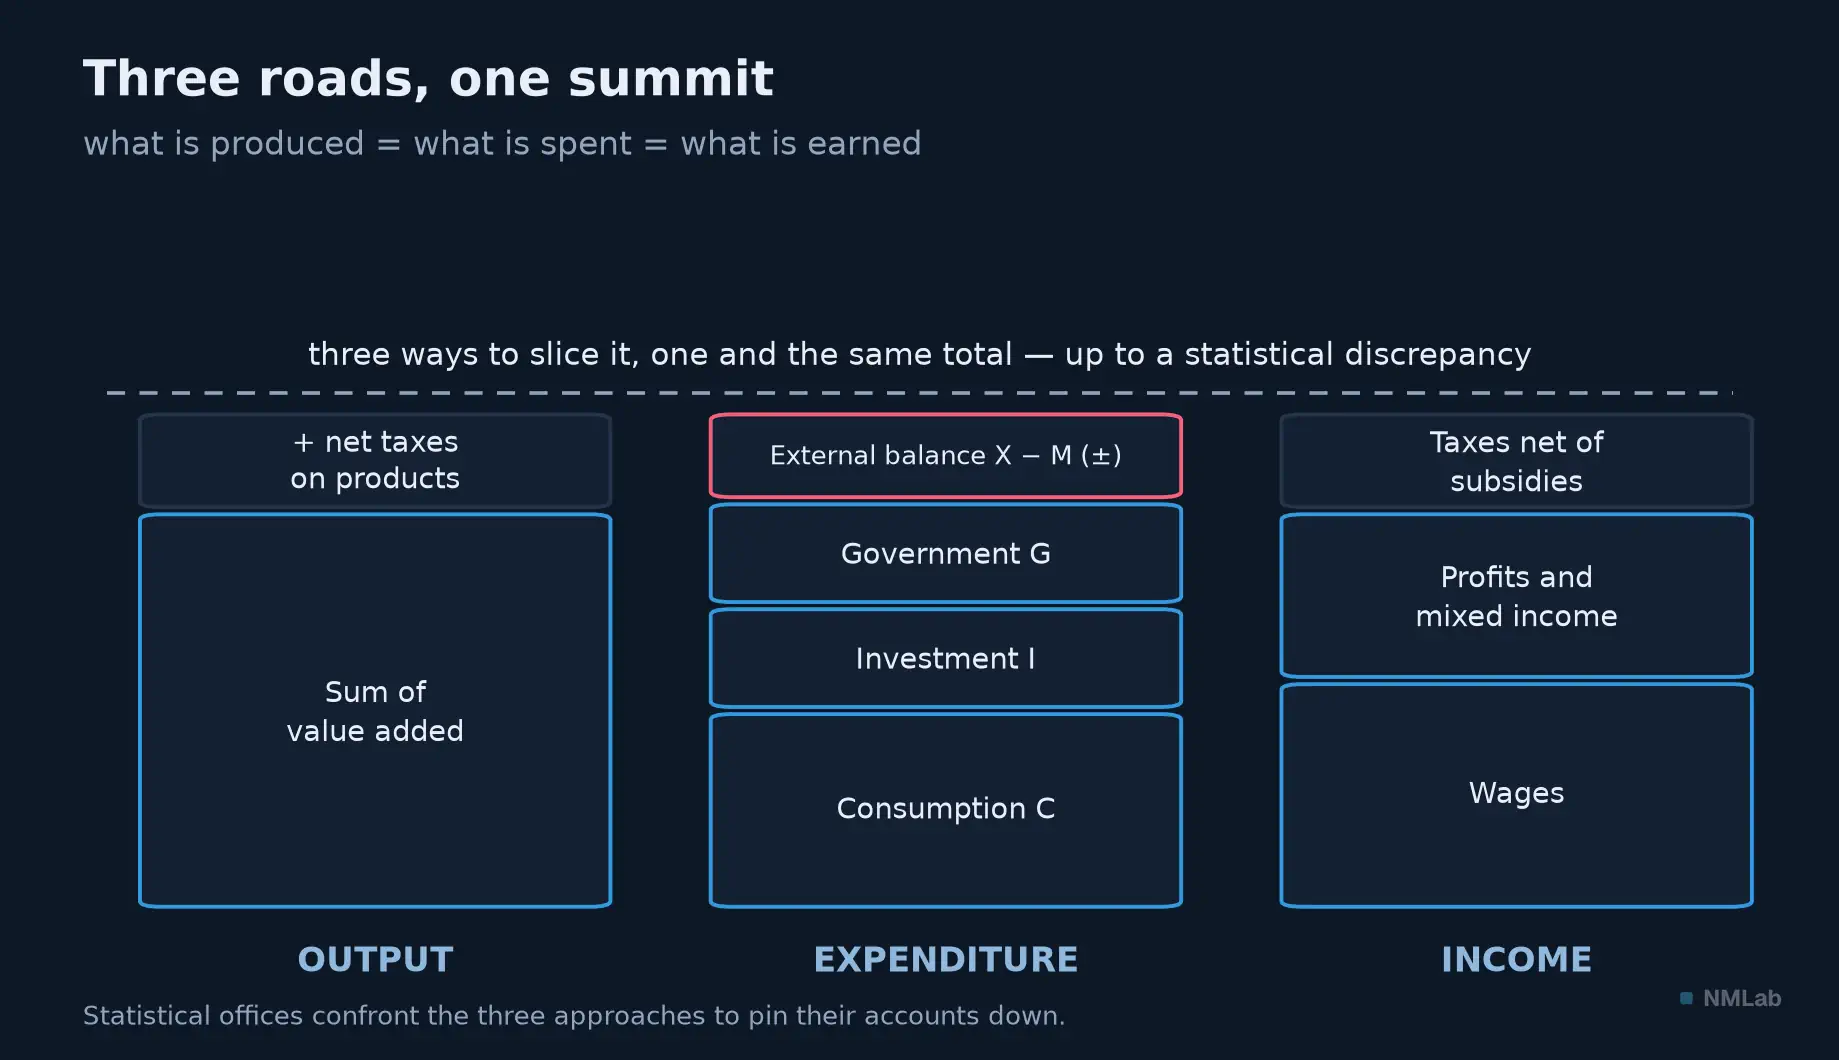
Produced, spent, earned: three ways of slicing one total, which statistical offices confront to pin their accounts down.
C + I + G + (X − M): the equation you will see everywhere
The expenditure road gave macroeconomics its most famous formula: GDP = C + I + G + (X − M). Four blocks, and most of the economic press becomes readable. The weights below are American, for 2025.
C for household consumption: 68 dollars out of every 100 — against roughly fifty in the euro area. America is an economy of consumers, which is why the American consumer's mood obsesses markets. I for investment: factories, offices, housing, software, R&D — 18 dollars out of 100. Beware the false friend: "investing" in the stock market is not investment in the GDP sense — buying a share produces nothing, it transfers ownership. This block also houses the change in inventories we met above, tiny in level but tyrannical at the margin: warehouses filling or emptying are enough to whipsaw a quarter. G for government purchases: the consumption and investment of public administrations — 17 dollars out of 100. Here lies a trap that bites wherever the size of the state is argued about: pensions, benefits and health reimbursements are not in G — they are transfers, money moved rather than production, and they only join GDP if households spend them (inside C). That is how France can report public spending at 57% of GDP while its G sits near 24%: the first counts every euro the state moves, the second only what it produces or buys. The same gap opens in Washington or London, just at smaller numbers — and it is why "public spending at X% of GDP" never means the state produces X% of the economy.
Which leaves (X − M), net exports: what the rest of the world buys from us minus what we buy from it — −3 dollars out of 100 in the United States, which runs a trade deficit. Hence the equation's most widespread misreading: "imports subtract from GDP." No — subtracting M merely cancels what C, I and G had counted in excess, the imported share of what they spend. But the arithmetic traps everyone: in the first quarter of 2025, American firms front-loaded imports to beat the coming tariffs, and GDP printed negative (−0.6% annualized) while domestic demand held — before a flattering +3.8% rebound as the move unwound. A professional's first instinct: when a GDP print surprises, check what inventories and trade did before anything else. Analysts even track final sales to private domestic purchasers, an aggregate stripped of those two volatile blocks — the "core" of GDP, far steadier.
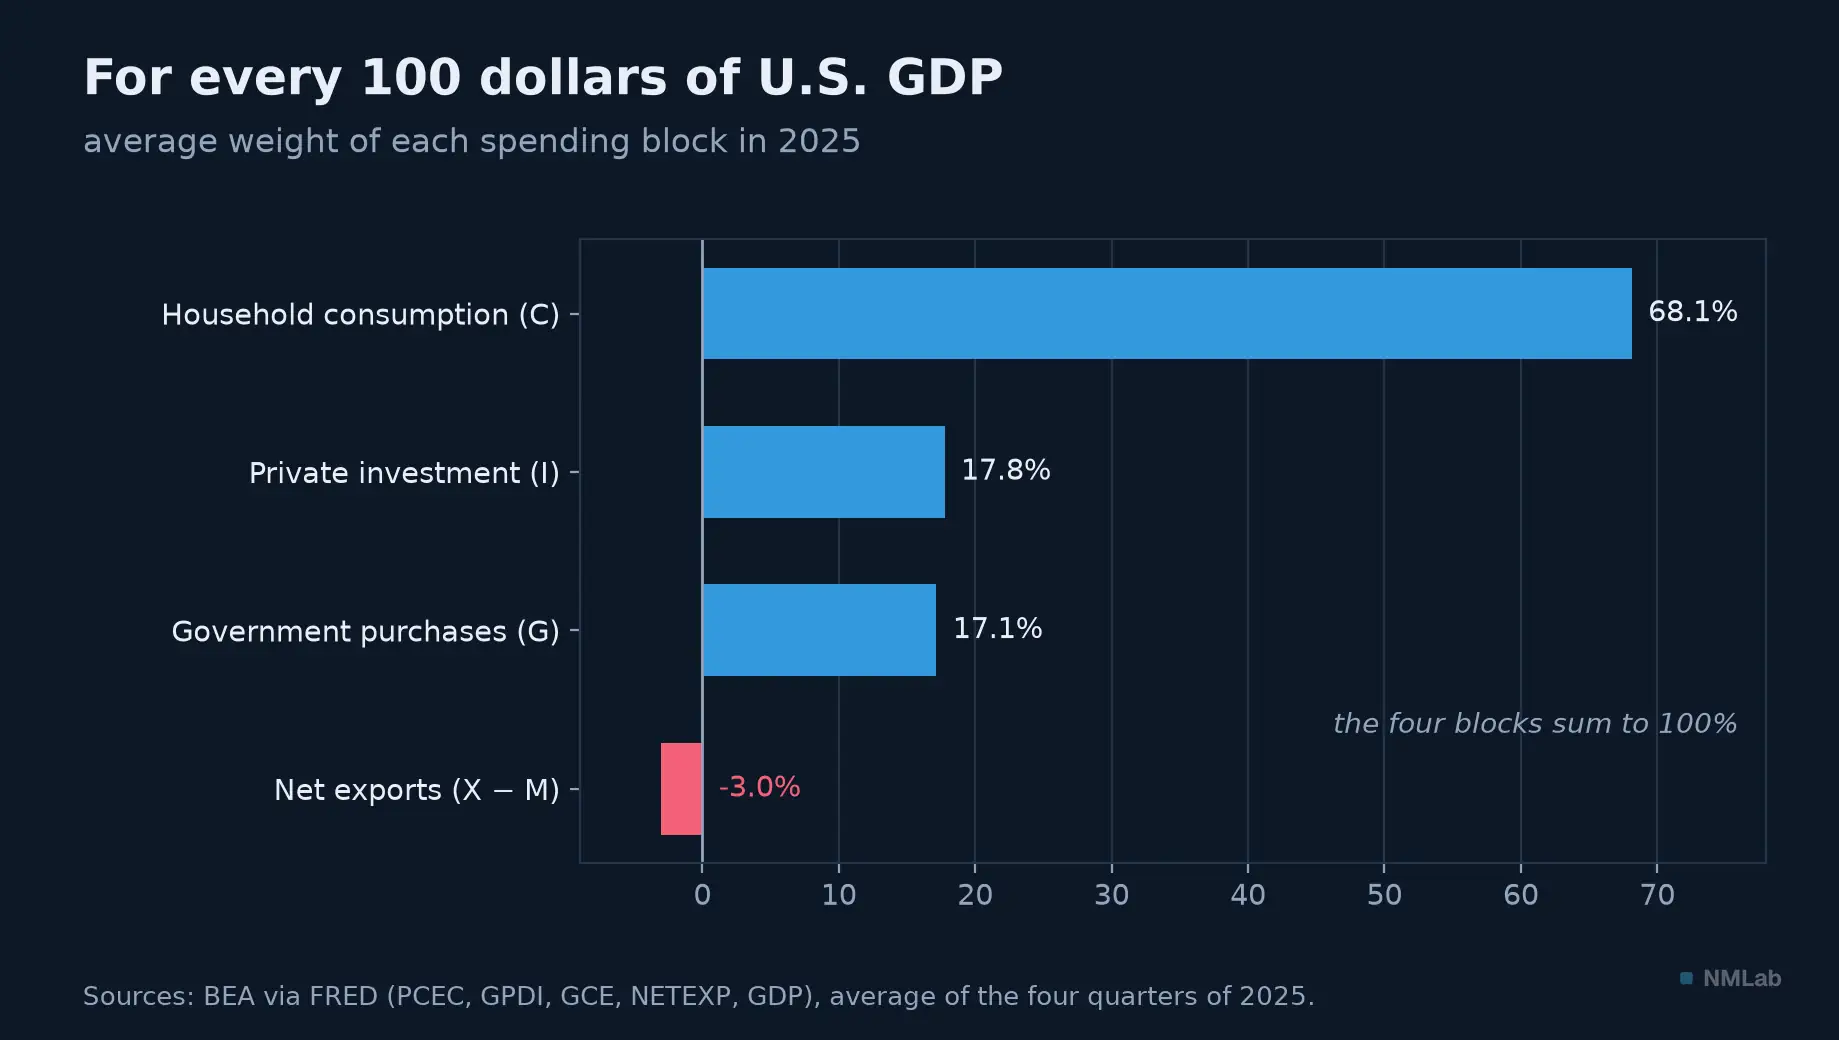
America in four bars: more than two-thirds of GDP goes through household consumption.
Reading a GDP release like a professional
GDP is the most complete indicator — and the slowest. Quarterly, it reaches you cold: the American "advance" estimate lands about a month after the quarter ends, followed by two revisions; Eurostat publishes its preliminary "flash" on the same horizon. Markets, meanwhile, live to the rhythm of monthly data and nowcasts, those real-time GDPs recomputed at every release, like the Atlanta Fed's GDPNow we met in chapter 6.
Then comes the trap of conventions, responsible for more than one false headline. The United States publishes growth at an annualized pace: the quarter's change, extended by convention over four quarters. Europe publishes the plain quarter-on-quarter change; commentators and institutes often add the year-over-year comparison with the same quarter a year earlier. Three conventions, three true numbers for one reality: in the third quarter of 2025, U.S. growth was at once 1.1% (q/q), 4.4% (annualized) and 2.3% (year-over-year). An American "4.4%" has therefore never been comparable to a European "1.1%." Check the convention before reacting.
Two more habits worth building. One: the number will move — America's 2022 "technical recession," two consecutive negative quarters, vanished from the revised data; and the official recession is declared by the NBER's dating committee on a weight of evidence, never by the mechanical two-quarter rule. Two: the growth number you read is "real," corrected for inflation — otherwise the $30,762 billion of the opening figure would mostly tell the story of prices. That distinction deserves better than a paragraph: it is the subject of the next chapter.
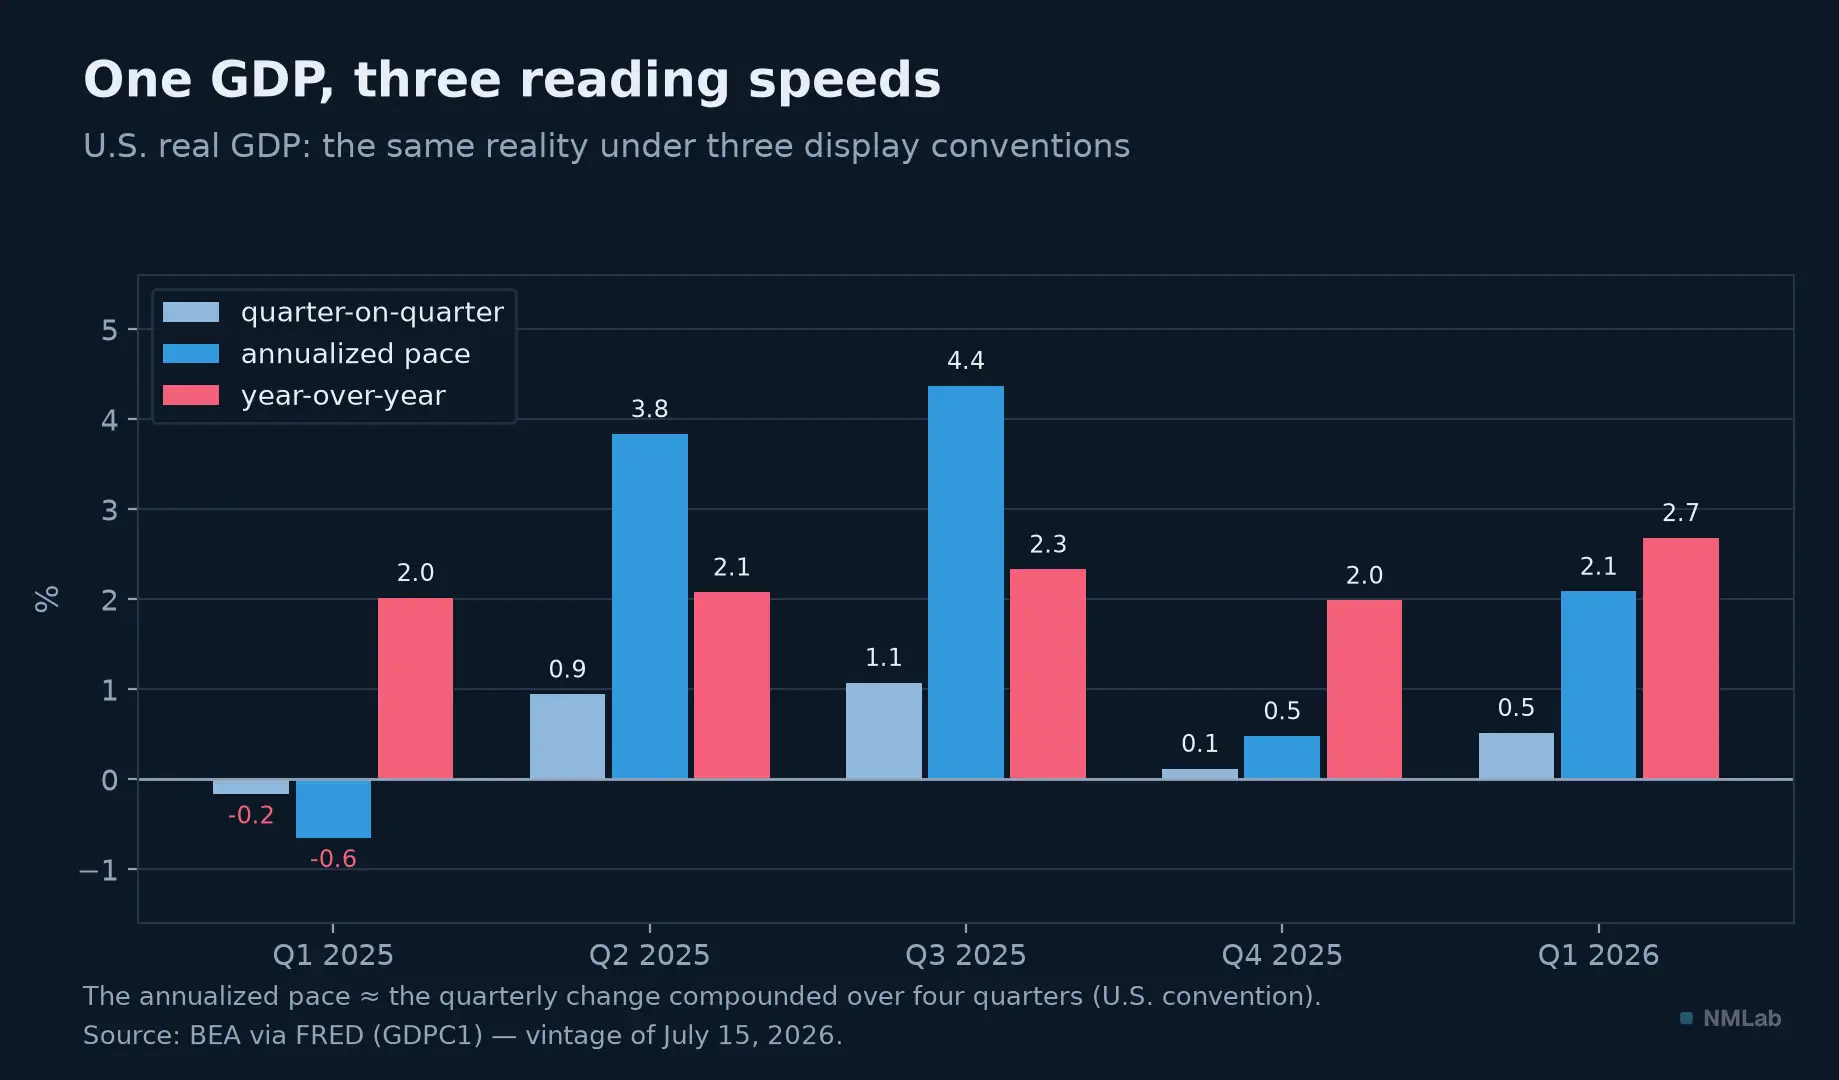
Three conventions for the same quarters: in Q3 2025, "1.1%," "4.4%" and "2.3%" are all true.
Comparing countries without fooling yourself
GDP also serves as the scale for weighing nations. But "which is the world's largest economy?" is not one question: it is three, and most barroom arguments are just a confusion between them.
Who weighs most? In raw size, converted at current exchange rates: the United States dominates with some 19,000; then comes a tight pack — Germany, Japan, India — around $4,000. That is the ranking that matters for global markets, where trade and financial flows settle at current exchange rates.
Where do people live best? Divide by population, and the ranking falls apart: the average American "produces" nearly 56,000, the Chinese 2,600. India and Germany, near-twins in total GDP, thus live in different worlds in GDP per capita — the former with more than twenty times the population of the latter. Correct once more: a dollar does not buy the same things in Zurich and in Delhi, and purchasing power parity, which converts at local prices, reshuffles the ranks — in PPP terms, China has ranked first since the mid-2010s. Hence the rule: PPP for living standards, current dollars for weighing markets.
And the catch? GDP per capita is still average production per head, not the median resident's standard of living: Luxembourg is inflated by its cross-border commuters, counted in GDP but not in the population; Ireland, as we saw, by its multinationals; and an average says nothing about the sharing. Depending on the question, prefer national income per head, actual consumption or the median — or per-head growth: measured against its working-age population, ageing Japan's growth, so dull in the headline, nearly matches America's.
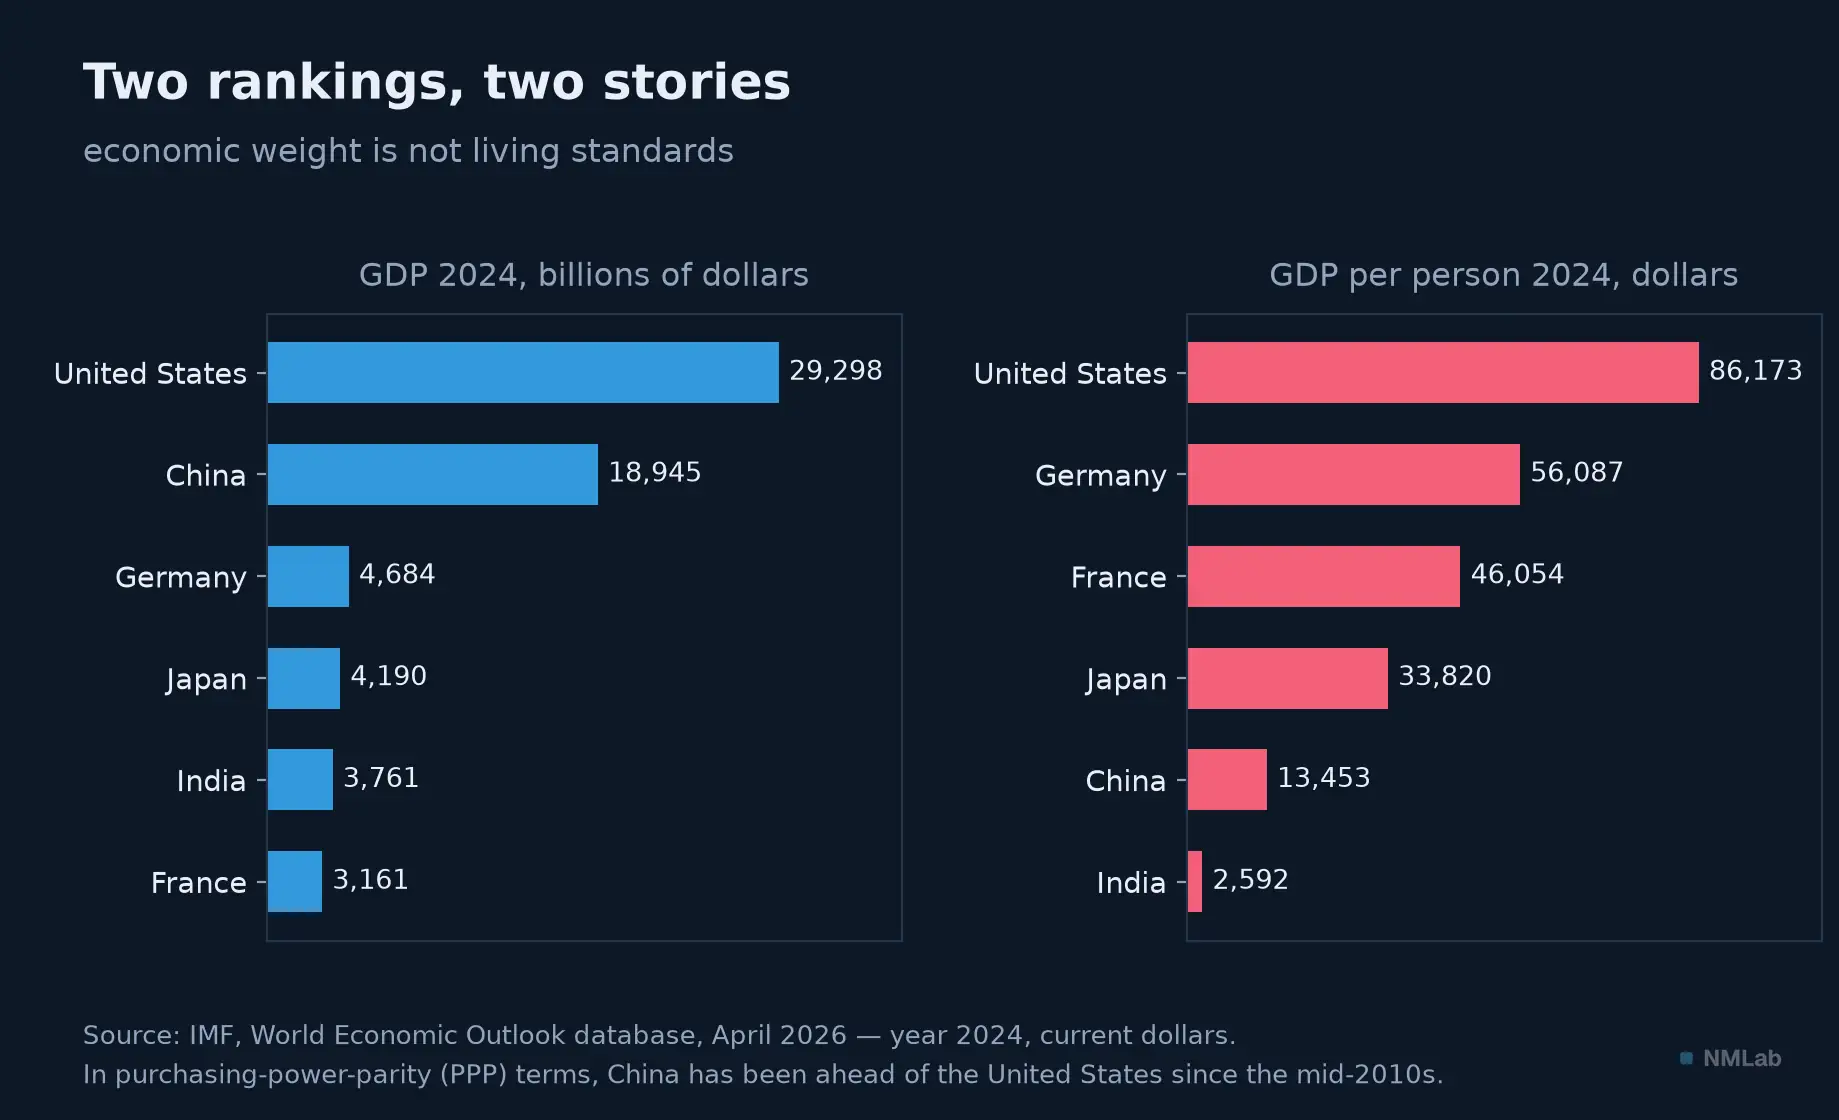
Near-twins in total GDP, India and Germany live in different worlds per inhabitant.
What GDP does not see
Kuznets signed the warning as early as page 7 of the 1934 report: "the welfare of a nation can, therefore, scarcely be inferred from a measurement of national income." Thirty-four years later, Robert Kennedy turned it into a famous speech at the University of Kansas: gross national product "measures everything, in short, except that which makes life worthwhile." Neither was asking to abandon the tool — only not to make it say what it does not measure.
The inventory of blind spots is instructive. The non-market: raising your children, keeping your house, helping a neighbor — genuine production, invisible because free; economists have passed around, since Pigou, the paradox of the man who marries his housekeeper and thereby shrinks the national income. The stock: GDP is a flow — a disaster inflates it through the rebuilding it triggers, without ever deducting what it destroyed; that is Bastiat's broken window, and the same myopia applies to nature: felling a forest is income somewhere, its disappearance is an expense nowhere. Free digital goods: maps, encyclopedias, messaging weigh almost nothing because almost nothing is invoiced — $17,530 is the median compensation internet users demanded to give up search engines for a year. Distribution, finally: an aggregate does not say who gets what — a rising average can hide a stagnating median.
Hence the attempts to go beyond — the UNDP's Human Development Index, the 2009 Stiglitz-Sen-Fitoussi commission, the "beyond GDP" dashboards —, all born of the observation that what we measure ends up steering what we do. None has dethroned GDP: it is comparable across countries, published every quarter, and it is the denominator of the ratios that govern policy. Take it for what it is — the aircraft's altimeter: indispensable, calibrated, and perfectly silent about the passengers' comfort.
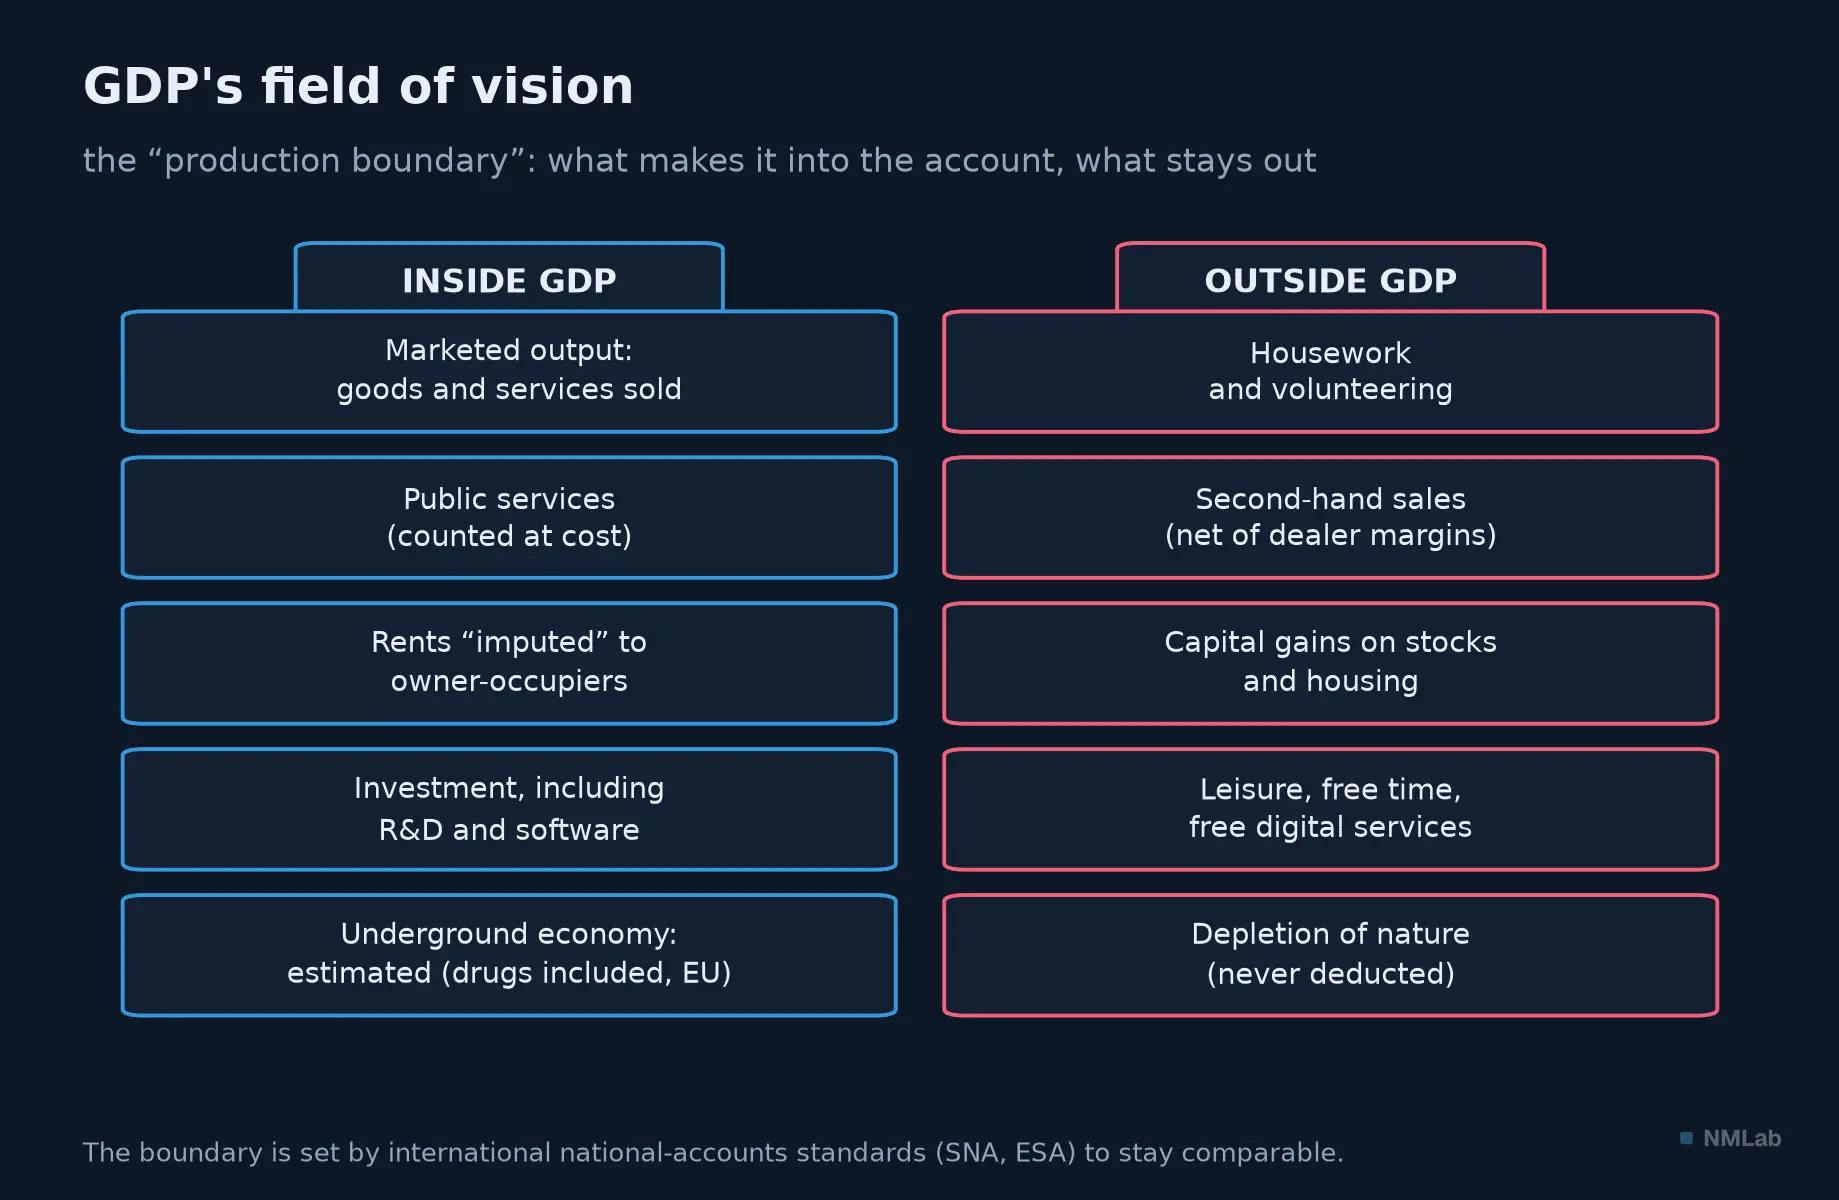
The "production boundary": not everything that counts is counted, and not everything counted is well-being.
GDP and your investments
For the investor, GDP plays three roles — only one of which is the one people assume.
First role, the sturdiest: universal denominator. Debts, deficits and capitalizations are only judged as a percentage of GDP — the European Union's famous ceilings of 3% for the deficit and 60% for the debt, both expressed as a share of GDP, or the market-capitalization-to-GDP ratio Warren Buffett called in late 2001 "probably the best single measure of where valuations stand." Second role: the long tide of profits. The mass of profits follows the size of the nominal economy — but loosely: their share of U.S. GDP has gone from 3.7% in 1986 to 12.4% in early 2026, more than tripling. GDP sets the tide; it says nothing about your boat.
Third role, the one wrongly lent to it: predictor of stock returns. The shortcut is irresistible — an economy that grows faster must enrich its shareholders faster. It is empirically false. Over sixteen countries and a century of data, Jay Ritter measures a negative correlation (−0.37) between real per-capita GDP growth and real equity returns. Sixteen countries is few: the estimate is noisy, and the exact figure is not worth clinging to — remember chapter 6, a coefficient is an estimate, not a weighing. What survives, though, is the part that matters: the positive link everyone expects is nowhere to be found. The countries that grew the most have not, on average, paid their shareholders better.
Three mechanisms explain that disconcerting result. The first, you have known since chapter 1: what matters is not growth, but its gap to what prices already carried. An economy everyone knows will grow 8% a year is paid for in advance, at a rich price — and future returns are docked accordingly. It is March 23, 2020 in reverse — the day the Fed pledged to buy without limit: indices turned a year before the economy did, because they were buying a recovery nobody could yet see. The second is the least known: growth dilutes. An economy that grows fast does so by creating firms and issuing shares — and most of the new value goes to the entrants, not to yesterday's holder. The pie grows, but the slices are recut along the way: an index's return measures value per share, not the size of the pie. The third: listed companies are not the domestic economy. About 30% of S&P 500 revenues is earned outside the United States — S&P Global's own figure, routinely inflated to "40%" in the press; conversely, the fabric that drives an emerging country's growth is often unlisted, or listed elsewhere.
One crucial qualification, though: what GDP fails to predict is long-run equity returns. In the short run, a release that surprises does move prices — and bond prices first. Growth stronger than expected tightens expectations for monetary policy: rates rise, the bonds already in your portfolio lose value, the currency firms up. This is chapter 4's channel, the most direct and most mechanical route from GDP to a portfolio — and it explains the paradox met there: good economic news can push bonds and stocks down at once, if it pushes rate cuts further away. "GDP does not predict the stock market" therefore does not mean "GDP moves nothing."
China in the 1990s-2010s brings all three mechanisms together: growth among the strongest in history, and a lastingly disappointed local shareholder. The lesson is not "ignore macro" — that is the exact opposite of this course — but: do not confuse understanding the economy with predicting prices. GDP tells you which world you are investing in and which risks weigh on your portfolio; it does not tell you what to buy tomorrow. The last chapter of this module will come back to it: growth that is already priced in no longer pays.
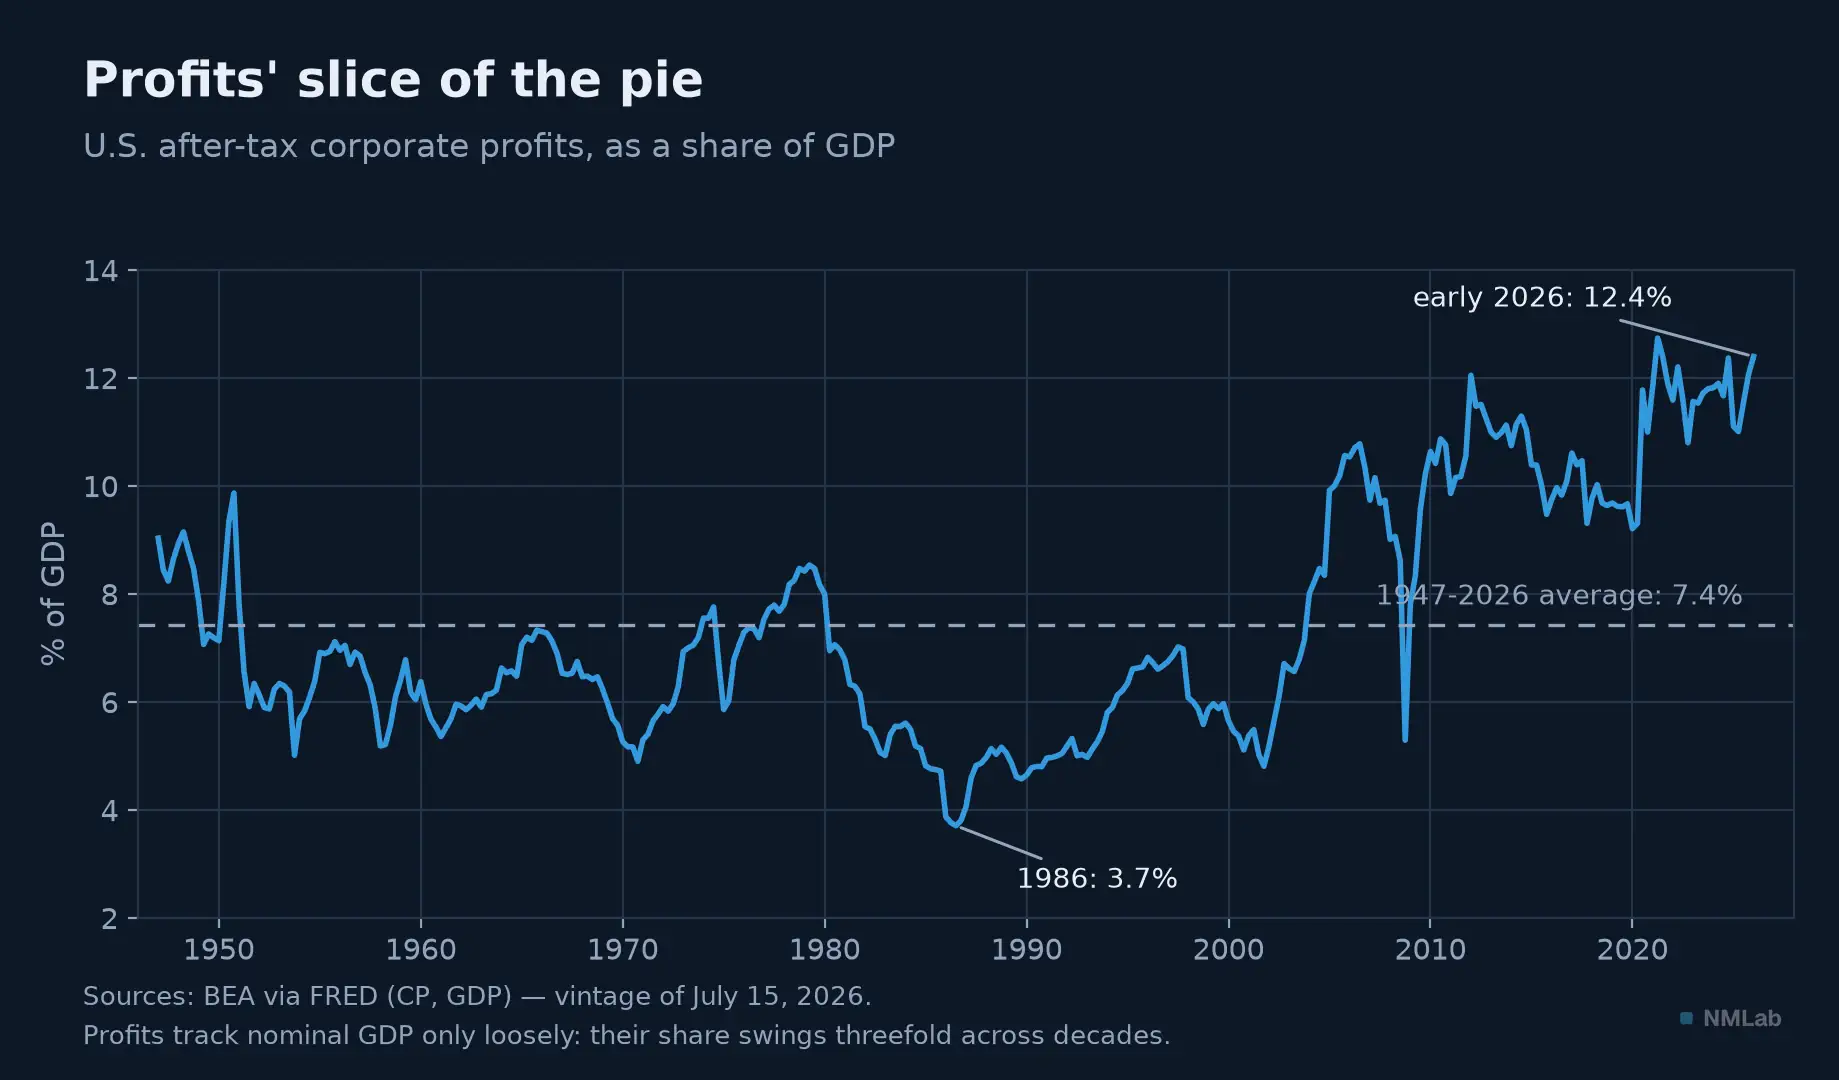
The mass of profits follows nominal GDP — loosely: the slice of the pie varies threefold across decades.
Key takeaway
- What it counts, and by which roads — The value added produced on a territory over a period: final goods and services, at market prices — not housework, not second-hand sales, not transfers. It is added up along three equivalent roads (output, expenditure, income), because everything sold pays someone and because the unsold is counted as a purchase of inventory.
- The equation — The expenditure road gives C + I + G + (X − M): 68, 18, 17 and −3 dollars per 100 in the United States in 2025. Imports subtract nothing: taking out M merely cancels what C, I and G counted in excess.
- Reading it — Check the convention (U.S. annualized ≠ European q/q ≠ year-over-year), expect revisions, take it corrected for inflation. When a print surprises, look at inventories and trade first.
- Comparing countries — Per capita and at purchasing power parity for living standards; in current dollars for weighing markets.
- Its blind spots — The non-market, free digital goods, nature, distribution. An altimeter: indispensable, and silent about the passengers' comfort.
- And your investments — An excellent denominator, a decent long-run tide for profits, a poor predictor of equity returns (anticipation, dilution, the gap between listed firms and the domestic economy). A GDP surprise, however, really does move rates.
The rest of the journey
The watch is open: you know what GDP counts, by which roads it is added up, how to read it and what it leaves outside. The most insidious trap remains: the $30,762 billion of the opening figure are in current dollars — much of the century's slope is just inflation, and a GDP that "rises" can hide production that stagnates. Separating volumes from prices is the art of real GDP and its deflator. Next chapter: "Real GDP and Nominal GDP: Why Correct for Inflation." Until then, one exercise: at the next release, look up the display convention before you look at the number — you will never again read "growth" as a single number, and that is exactly the point.
Sources and further reading
- Simon Kuznets, National Income, 1929-1932, report to the U.S. Senate (Document No. 124, 73rd Congress), January 4, 1934, digitized on FRASER — including the page-7 warning on welfare.
- U.S. Department of Commerce, "GDP: One of the Great Inventions of the 20th Century," Survey of Current Business, January 2000.
- Diane Coyle, GDP: A Brief but Affectionate History, Princeton University Press, 2014 — including the blind-flying before national accounts: share-price indices, freight-car loadings.
- Robert F. Kennedy, speech at the University of Kansas, March 18, 1968.
- Arthur C. Pigou, The Economics of Welfare, 1920 — the married housekeeper.
- Frédéric Bastiat, "That Which Is Seen, and That Which Is Not Seen," 1850 — the broken window.
- Jay Ritter, "Economic Growth and Equity Returns," Pacific-Basin Finance Journal, 2005 — a −0.37 correlation, 16 countries, 1900-2002; and the dilution mechanism.
- Erik Brynjolfsson, Avinash Collis & Felix Eggers, "Using massive online choice experiments to measure changes in well-being," PNAS, 2019 — the $17,530.
- Warren Buffett & Carol Loomis, "Warren Buffett on the Stock Market," Fortune, December 10, 2001.
- S&P Dow Jones Indices, S&P 500 Foreign Sales (annual report) — the share of S&P 500 revenues earned outside the United States, on the order of 28 to 30% depending on the vintage.
- Stiglitz-Sen-Fitoussi Commission, Report on the Measurement of Economic Performance and Social Progress, 2009.
- Figure data: BEA via FRED (GDPA, GDP, GDPC1, PCEC, GPDI, GCE, NETEXP, CP) and IMF (World Economic Outlook) — vintage of July 15, 2026.