10. Real GDP and Nominal GDP: Why Correct for Inflation
· Updated on · 19 min read
Washington, October 8, 1974. Before a joint session of Congress, Gerald Ford declares war on America's "public enemy number one": inflation. The president wears on his lapel a red button stamped with three white letters — WIN, Whip Inflation Now — and urges households to grow more and waste less, down to cutting the food they throw away by 5%. History will mostly remember the irony: while the country is being mobilized against rising prices, the American economy has been in recession for eleven months — the NBER will date it from November 1973 to March 1975 — and almost nothing shows it in the country's most watched number. That year, the GDP of the United States grows by 8.4%. A boom-time figure. The volumes produced, meanwhile, shrink by 0.5%: factories slow down, unemployment climbs, and the country has not forgotten the previous winter's lines at the gas stations.
Eight point four percent on one side, minus zero point five on the other: the gap — close to nine points — is the price of output, up about 9% in the wake of the oil shock. Beware, incidentally, of reaching for the inflation figure everyone remembers for 1974, 11%: that one is the consumer price index, a different thermometer, and confusing the two is precisely what this chapter teaches you to avoid — the gap between nominal and real growth is always read with the GDP deflator, never with the CPI. The thermometer was measuring its own fever. That is the trap this chapter teaches you to defuse — the most insidious in all of economic statistics, because it requires no measurement error at all: just an omission.
The previous chapter opened up the watch of GDP and stopped at the edge of this question: the $30,762 billion of America's 2025 GDP are in current dollars, volumes and prices mixed together. Nominal GDP, real GDP, the deflator: three technical-sounding words, and probably the most profitable reflex in this whole course — because it applies far beyond GDP, to wages, rents, stock-market records and your own account statements.
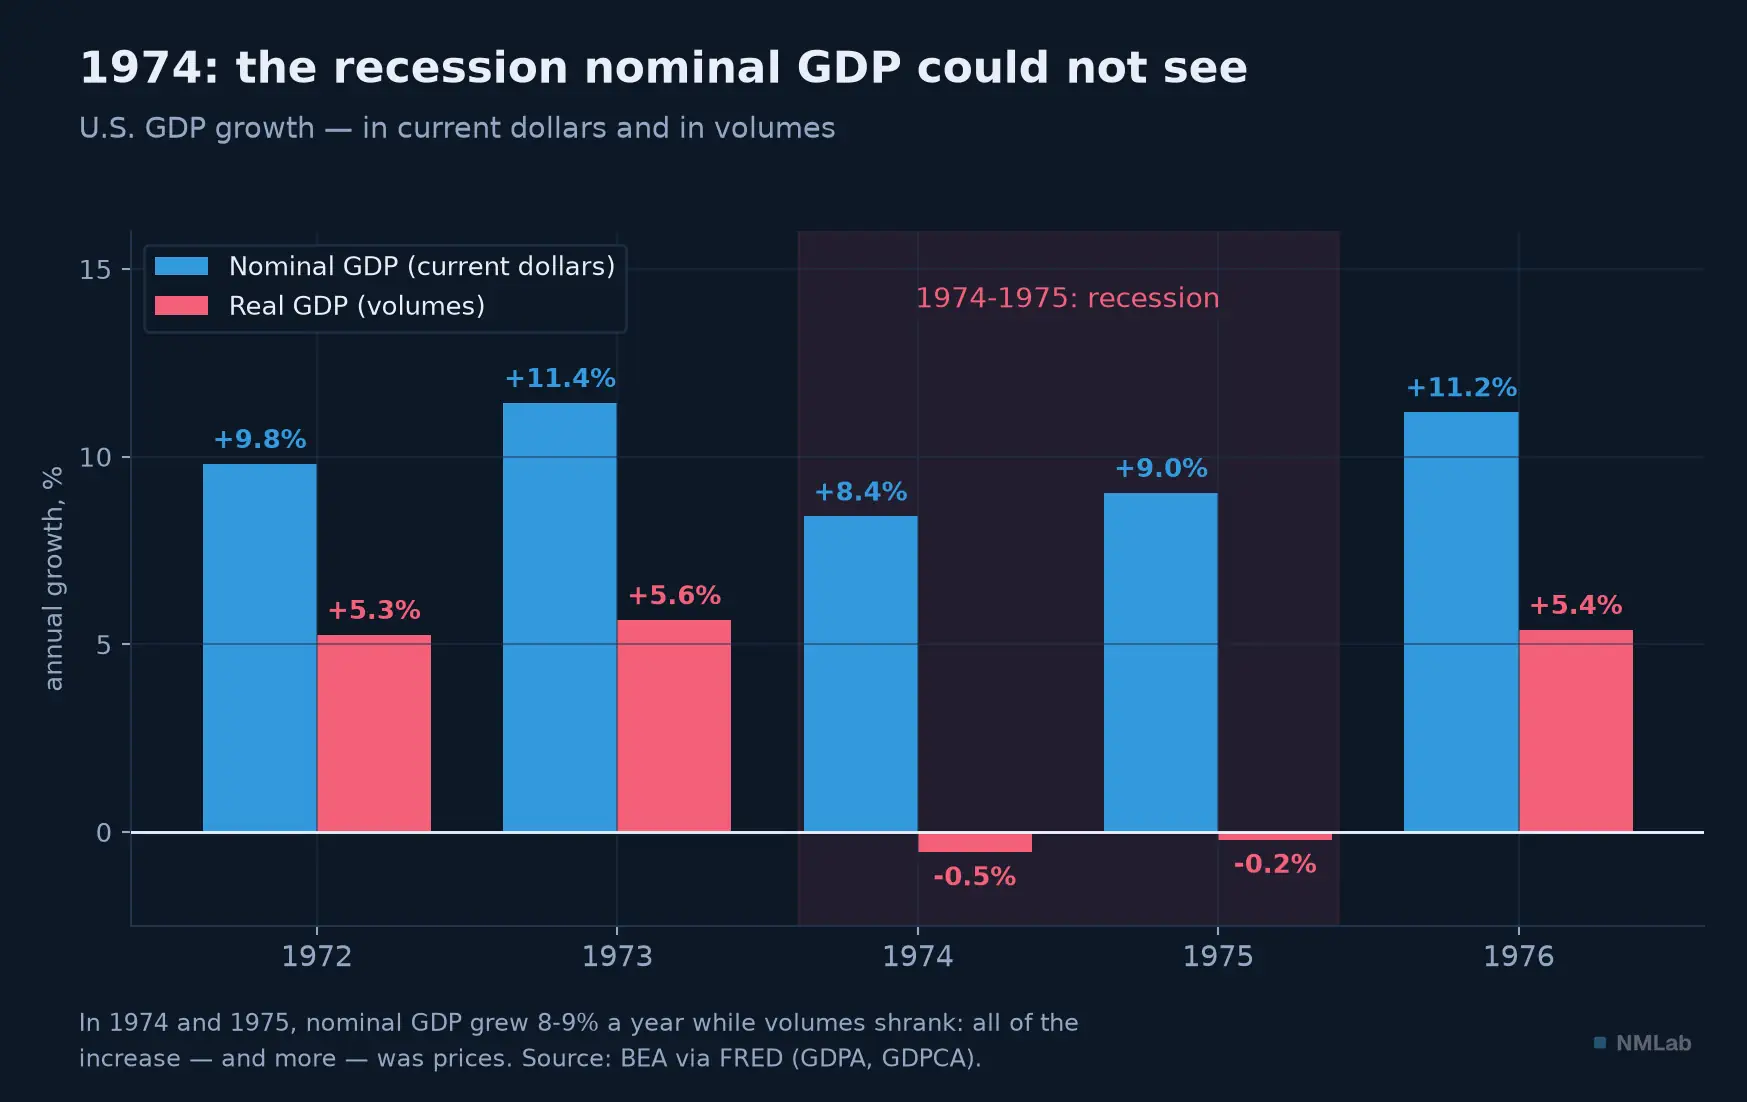
In 1974 and 1975, the nominal figure shows 8-9% growth while volumes shrink: the recession was invisible on the dial.

At a glance — Level: Intermediate · Prerequisites: chapter 9
By the end of this chapter, you will be able to:
- separate volumes from prices in any economic number;
- say what a deflator is, and why every "real" figure depends on the one applied to it;
- apply the only reflex that matters in front of an amount: real or nominal?
The section "How real GDP is made" goes into the detail of chain-linked indices: it can be skimmed without losing the thread.
Where the illusion comes from: prices multiplied by quantities
Remember the definition: GDP adds up values — for the most part prices multiplied by quantities, each stage's value added rather than its gross revenue, and production cost where there is no market. An economy that produces the same quantities as yesterday but sells them 5% dearer posts the same GDP as an economy that produces 5% more at yesterday's prices. Same number, two different worlds: in the first, nobody got richer; in the second, there really is more to share. An aggregate in euros or dollars cannot tell the difference — that is the whole infirmity of nominal GDP, also called GDP "in value" or "at current prices."
Real GDP — "in volume," "at constant prices" — is the statisticians' answer: each year's production is recomputed at the prices of one and the same reference year, so that only quantities (and quality — we will get there) move the number. The arithmetic linking the two fits in an approximation worth memorizing: nominal growth ≈ real growth + inflation (inflation as measured by the deflator). Purists compound rather than add, but at ordinary rates the addition is good enough — under two- or three-digit inflation, it breaks down — and it reads both ways: faced with a nominal "+5%," everything depends on the split between volumes and prices.
That split can change everything. Five percent nominal with 5% inflation is dressed-up stagnation. With 2%, healthy growth. With 7%, a hidden recession — exactly the America of 1974. Official vocabulary is locked down on this point: when INSEE, Eurostat or the BEA announce "growth," it is real GDP — the volume; they also publish growth in value, but it never makes the headlines. As soon as you leave that sanctuary — levels in billions, ratios, historical comparisons, political speeches — the nominal lurks, and the professional's first question never varies: real or nominal?
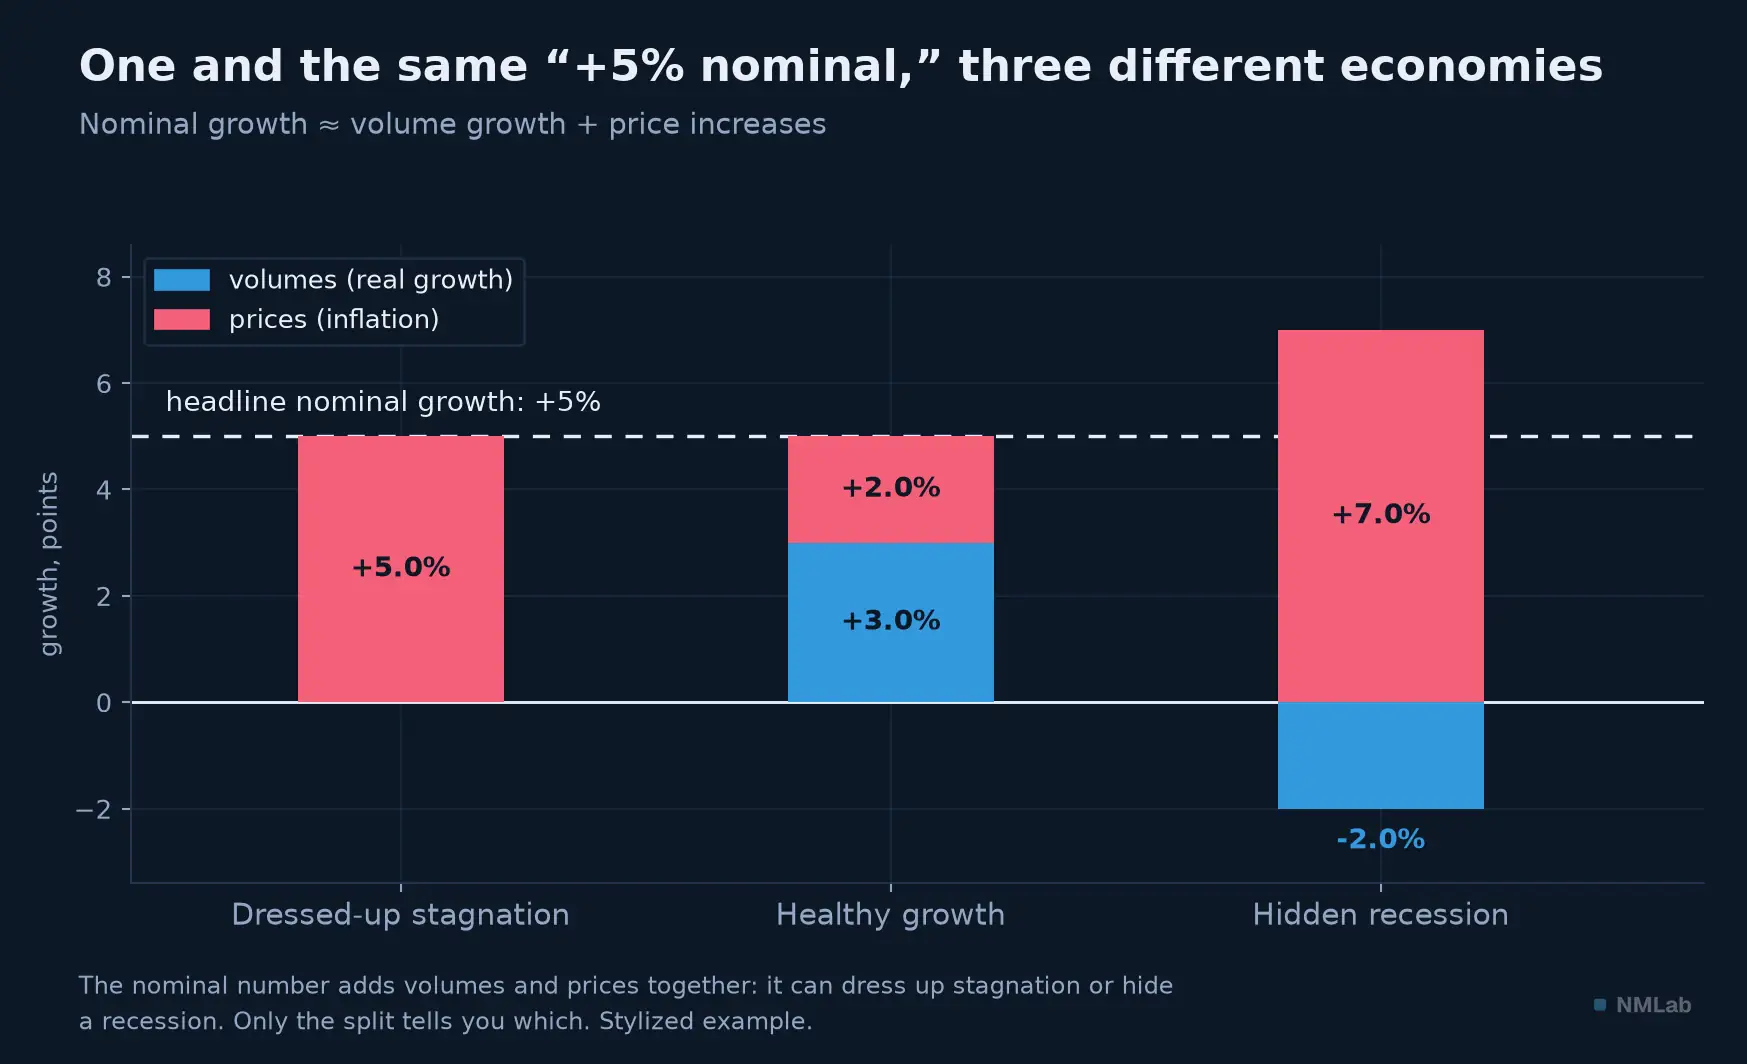
One and the same "+5%" can dress up stagnation or hide a recession: only the volume-price split settles it.
The GDP deflator: the thermometer hidden in the accounts
Put the two measures side by side for the United States of 2025: 23,850 billion in "chained 2017 dollars." The first number answers "what is production worth at today's prices?", the second "what would it be worth at 2017 prices?". Their ratio, multiplied by one hundred, is called the GDP deflator: 129.0 — the prices of America's entire production have risen 29% since 2017.
Put in a formula, the deflator is, for a given year , just a division rescaled to a base of 100 — with nominal and real necessarily referring to the same year:
Applied to the U.S. figures for 2025, it gives:
A trap to clear right away: those 23,850 billion in the denominator are not the GDP of 2017 — they are the output of 2025, simply recomputed at 2017 prices. Nominal and real therefore both refer to the same year, 2025; only the price tag changes. (The actual nominal GDP of 2017 was in fact markedly lower, on the order of $19,600 billion.) In the numerator and the denominator the quantities are the same — 2025's; they cancel out, leaving only the ratio of 2025 prices to 2017 prices. That is why this single year is enough to measure a rise "since 2017": the same basket of goods, priced twice, costs 29% more at today's tags.
A deflator of 129 reads plainly: it takes 129 dollars today to buy what 100 dollars paid for in 2017. And because these three quantities obey a single accounting identity, knowing any two always yields the third by simple rearrangement: from the nominal and the deflator, we land algebraically back on the real —
— the $23,850 billion we started from. Be careful, though, not to read this as a recipe for construction: the equality describes the link between the three numbers, it does not say how real GDP is built. Believing so would even be circular, since the deflator is itself defined as the ratio of nominal to real. In statistical practice the direction is the reverse: prices are deflated finely, product by product, each with its own price index (consumer prices, producer prices, foreign-trade prices), then aggregated and chained — the whole point of the section "How real GDP is made" below. The overall deflator is merely a by-product of that.
This deflator is an implicit price index — which does not mean it comes from nowhere: the underlying prices are collected in bulk (consumer prices, producer prices, foreign-trade prices). What is implicit is the overall index: nobody fixed its basket in advance, and its weights are those of the current year's GDP. And it is the broadest inflation thermometer there is: where the consumer price index tracks only the households' basket (imported goods included), the deflator covers everything the country produces — machines, software, public hospitals, exports — and excludes imports. The two sometimes diverge by several tenths, more when imported energy flares up; module 4 will compare them piece by piece. The essential: every "real" number has its deflator, and deflating by the wrong index is a classic mistake.
Which leaves the base year — 2017 in the current American accounts. By construction, nominal and real coincide there, and the deflator therefore equals exactly 100. After that, everything depends on which way prices go: as long as they rise — the usual case — real sits above nominal before that year and below it after. Recomputing the 1930s at 2017 prices means repricing every loaf of the era at twenty-first-century rates. Under deflation the configuration flips — Japan will show us shortly. Hence a figure that puzzles at first glance: the century's two curves cross in 2017, and the GDP of 1929 is worth both 1,191 billion (2017 dollars) — eleven and a half times more, the whole gap being the rise in the prices of American output over eighty-eight years.
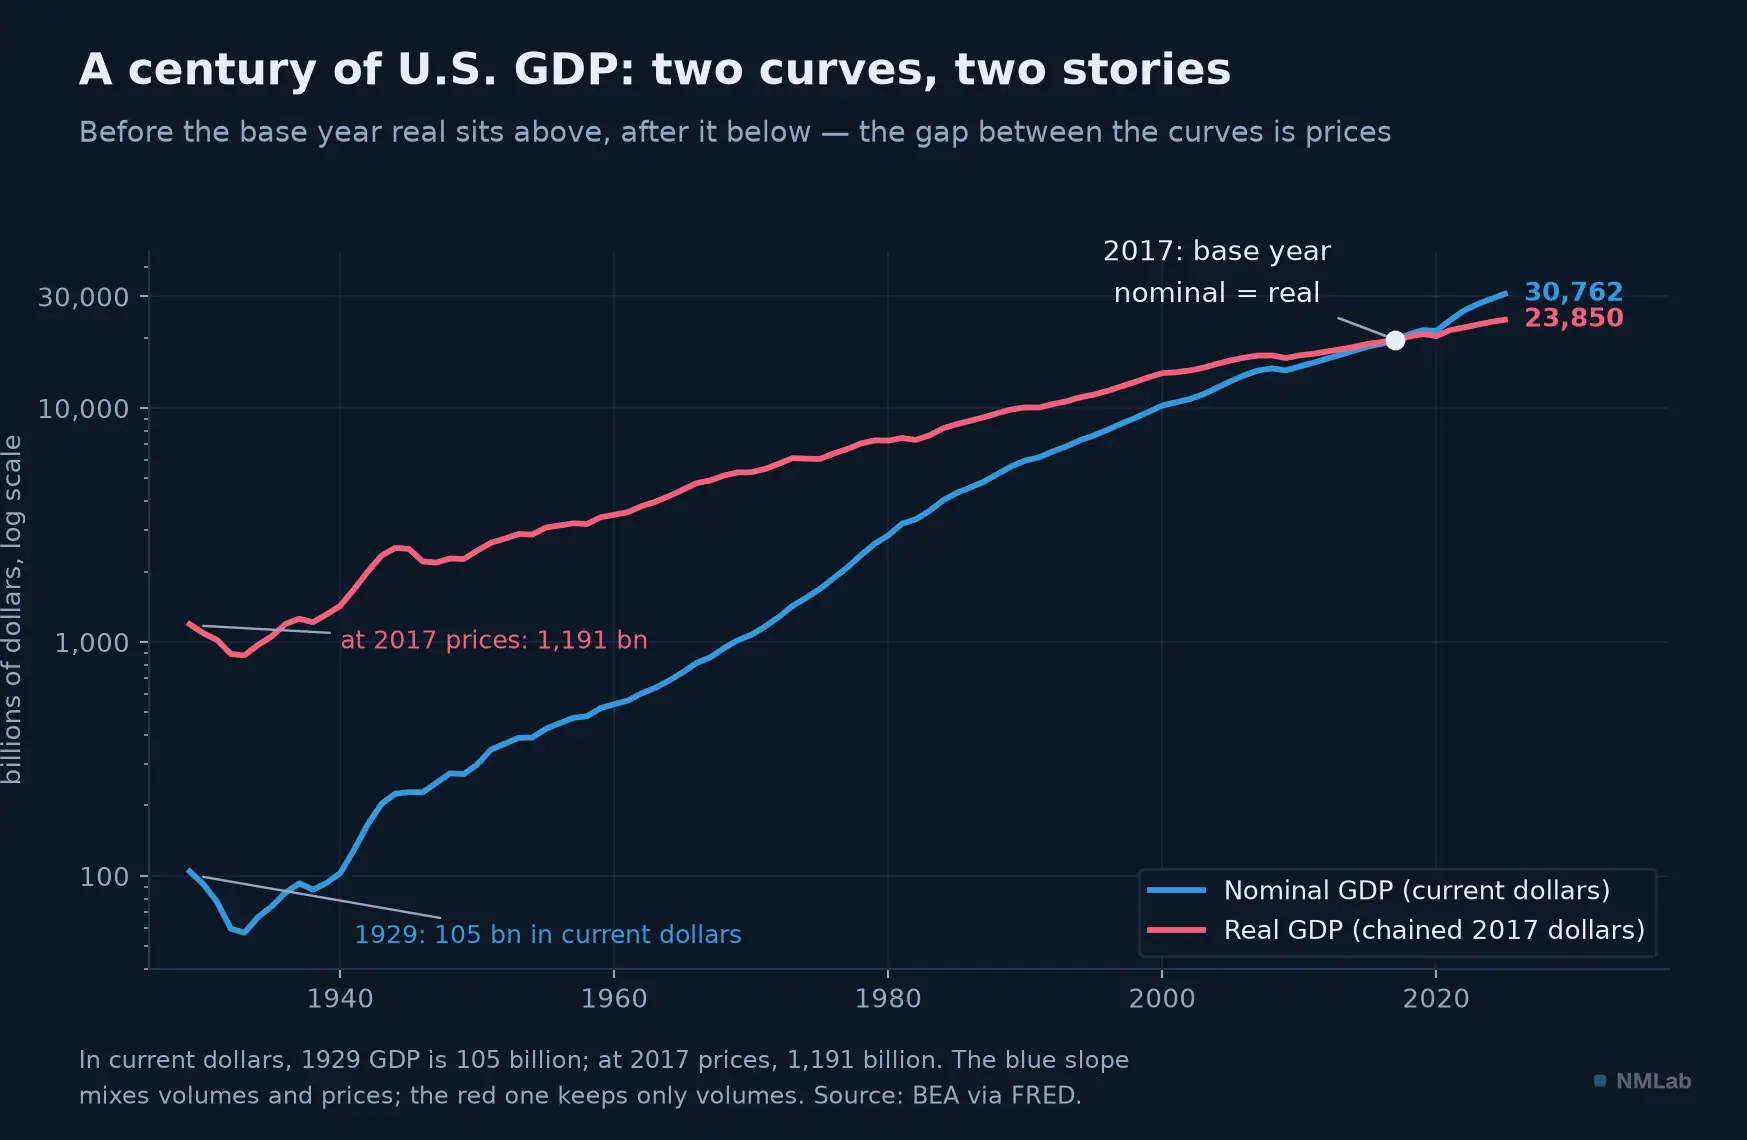
Two curves for one country: the nominal slope compounds volumes and prices; the gap between the curves is prices alone.
How real GDP is made: constant euros, chained prices
How are "volumes" manufactured? The historical method froze the prices of a base year and left them there for five or ten years. Simple, but wrong on a delay: the older the base, the more it weights yesterday's economy. The example that tipped everything over is 1990s computing. The goods whose quantities explode are precisely those whose relative price collapses: frozen at the base year's rates, they keep a weight the market no longer grants them, and growth is overstated — the more so as the base ages. That is the substitution bias, a cousin of the one the Boskin Commission was blaming, at the same moment, on the consumer price index (1.1 points too much per year, it said in 1996 — chapter 6 crossed its path).
The remedy, adopted by the BEA in 1996 and generalized across Europe in the 2000s, is called chain-linked volumes: nothing is frozen anymore; each year's growth is measured with contemporaneous price weights, and the links are then chained together. Europe chains at the previous year's prices; the BEA, for its part, uses a Fisher formula, which averages both years' prices — same spirit, different formulas. The "base year" is now merely a reference year where the index equals 100 — 2017 in the United States, 2020 in the current French accounts. The price to pay is an expert's paradox: chained volumes no longer add up exactly — the sum of real C, I and G does not land precisely on real GDP outside the reference year. If you ever discover this in a spreadsheet, it is not a bug.
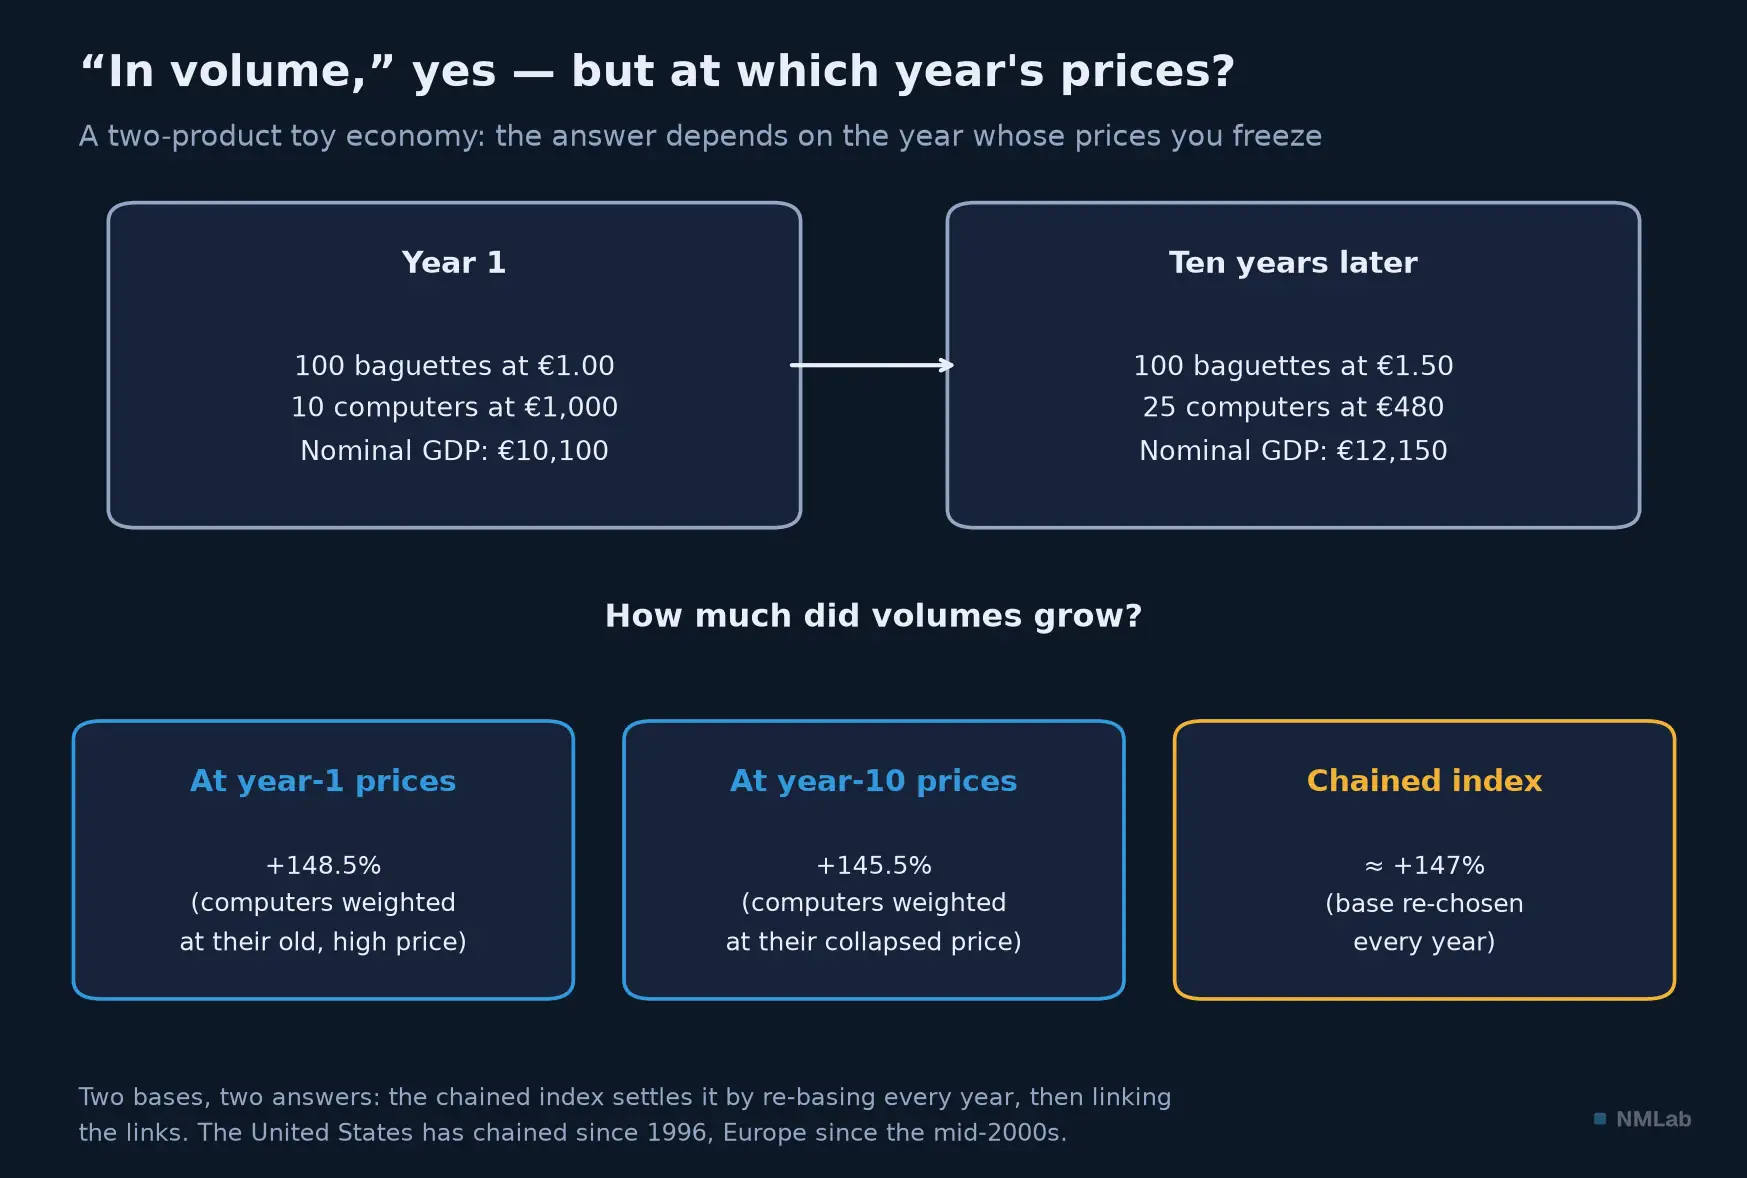
At year-1 or year-10 prices, the same decade does not show the same growth: chaining re-picks the base every year.
One last difficulty, the most philosophical: deflating assumes you compare identical products from one year to the next. But the €800 computer of 2026 is not the €800 computer of 2016. Statisticians correct for this with so-called hedonic methods — decomposing the price into characteristics (processing power, memory, screen definition) to isolate the increase "at constant quality." The stakes are not decorative: William Nordhaus showed, by reconstructing two centuries of the price of light, that traditional indexes missed most of the price declines born of new technologies.
One last trap: changing the base year does not change nominal GDP — current prices multiplied by current quantities, no reference year enters into it. Rebasing rescales the level of real GDP, a pure renormalization, and barely touches growth rates. If you read that a country "gained" 89% of GDP by changing its base — Nigeria in 2014, which became Africa's largest economy that day — the culprit is not the price year: it is the overhaul of the sources that came with it, bringing in whole sectors that had been poorly covered, telecoms and Nollywood chief among them. Only the latter moves the level. Real GDP is a construction — the most careful one possible, but a construction: we estimate, we do not weigh.
Three stories the nominal told badly
The America of the 1970s, first — the birthplace of the reflex. Over the decade as a whole, U.S. nominal GDP is multiplied by 2.66: +166%. Volumes gain only 37% — the rest is a price level that nearly doubled: more than two-thirds of the displayed "growth" was nothing but prices. That is stagflation — stagnation plus inflation — the regime that pushed "real GDP" into everyday language, and which module 5 will dissect as a case study.
Japan, next — the illusion in reverse. From 1995 to 2015, Japanese nominal GDP grows by 3.5%. Not per year: over twenty years. On the nominal dial, two lost decades, a country at a standstill. Volumes tell another story: +18.5% — modest growth, an ageing country's growth, but growth. The gap comes from a deflator down 12.7%: that is deflation, and it flips the trap — the nominal no longer overstates activity, it understates it. Japanese nominal GDP only wakes up with the return of inflation, after 2022 — to the point of finally clearing, in 2023-2024, the 600-trillion-yen bar Shinzo Abe had set as a target back in 2015. In 2025, the price level of Japan's GDP stands less than 1% above its 1995 level: thirty years for nothing, on the price side.
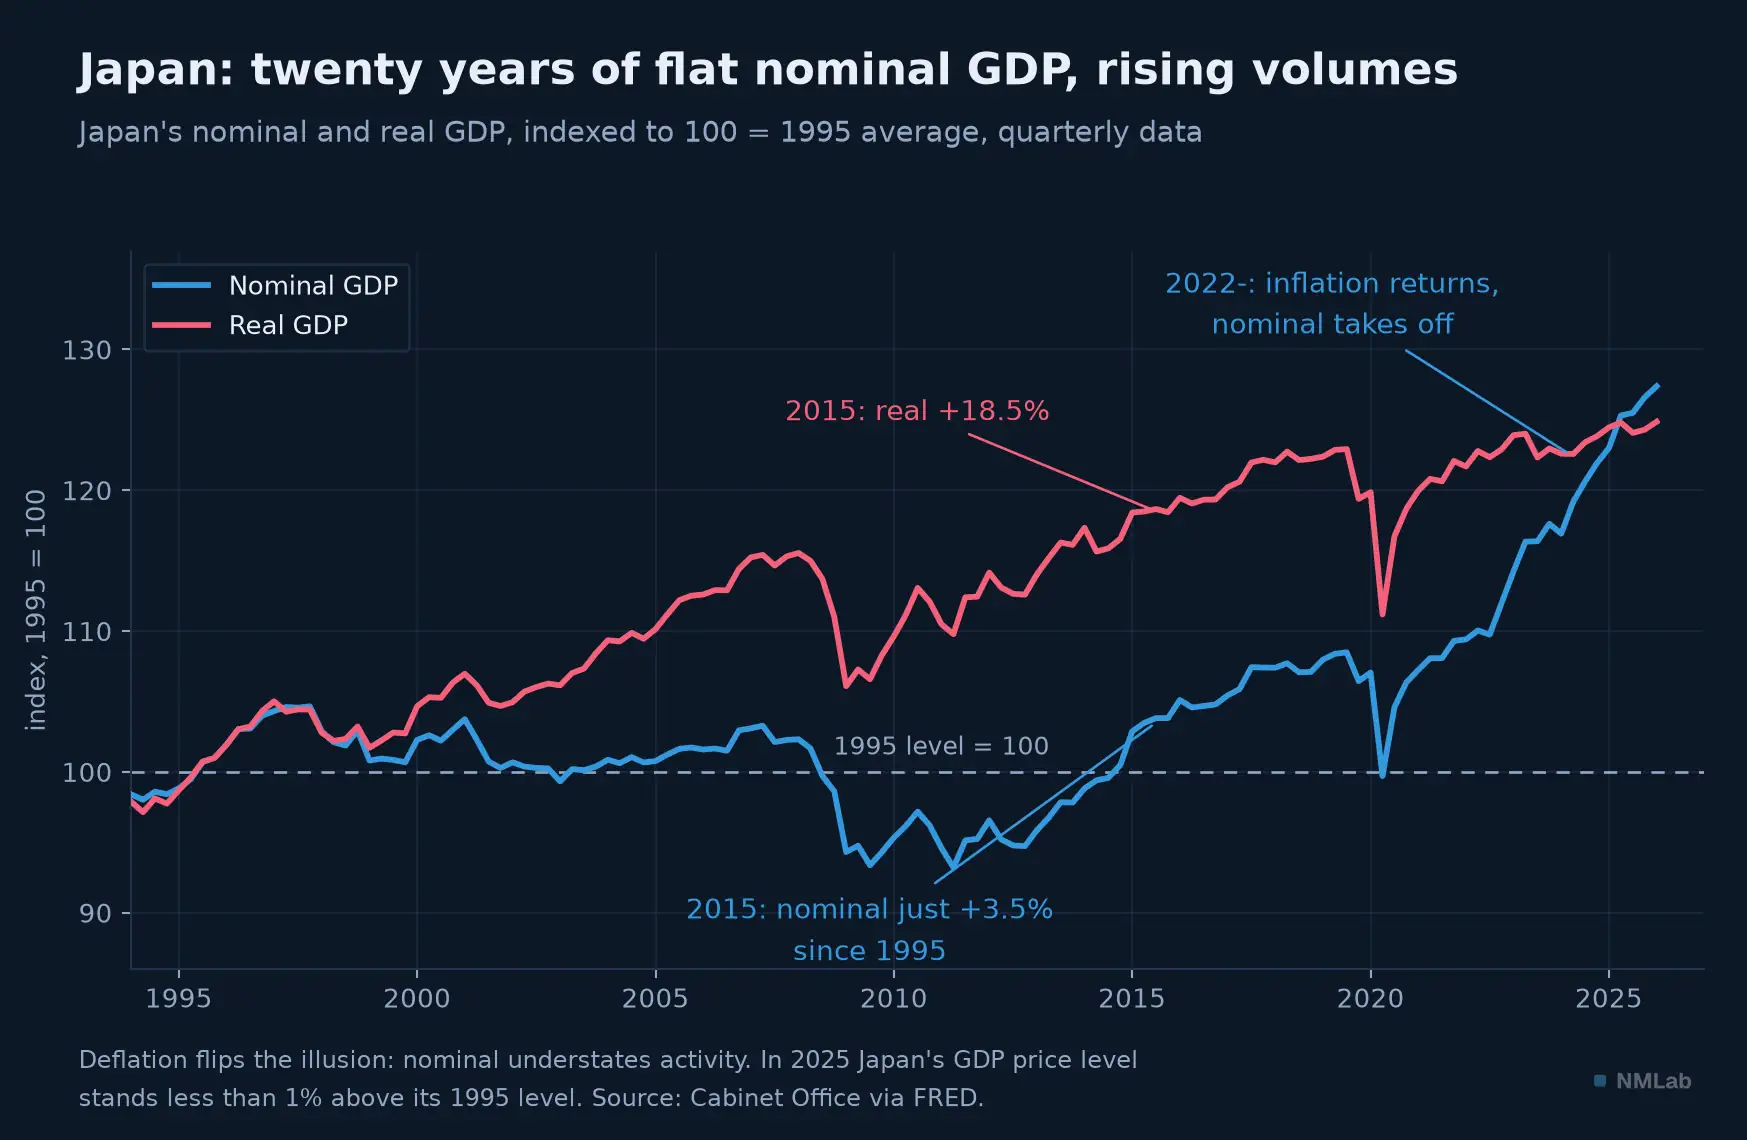
Under deflation the illusion flips: the Japan "at a standstill" of the nominal dial actually produced 18.5% more in 2015 than in 1995.
Turkey in 2022, finally — the limiting case. Nominal GDP: +106% in one year. Real GDP: +5.4%. With inflation peaking at 85.5% in October, the dial in Turkish lira no longer measures anything but the melting of the currency. That is the rule of high inflations, and it applies to every number that comes out of them: "record" revenues, stock markets "at all-time highs," wages "rising" — everything goes up, except what matters. You have, in fact, lived through a softened version: in 2022, U.S. nominal GDP jumped 9.8% — leaving aside 2021's reopening rebound, unseen since 1984 — for 2.5% of real growth. Tax receipts and profits were blazing; volumes were not.
When the nominal is what counts
Should you throw the nominal away, then? Absolutely not — and this is the subtlety that separates the reflex from the dogma. Your contractual world is written in current euros or dollars: wages, rents, loan payments, bond coupons, tax brackets. A €200,000 debt is owed to the euro, whether prices double or stagnate. That is precisely why inflation redistributes so much — on one condition intuition always forgets: it must be unanticipated. Surprise inflation relieves debtors at creditors' expense, without a single contract changing; expected inflation transfers nothing, because the lender already priced it into the nominal rate at signing. It is price surprises that redistribute, not their level.
American fiscal history offers the most spectacular demonstration. In 1946, federal debt weighs 119% of GDP — the price of the war. In 1974, 31%: cut by nearly four in under thirty years, with no notable budget surpluses. The numerator was frozen in the dollars of its era while the denominator — a nominal GDP — swelled with volumes and prices, interest rates kept low into the bargain. Keynes had described the mechanism as early as 1919: by a continuing process of inflation, governments can "confiscate, secretly and unobserved, an important part of the wealth of their citizens." The contemporary symmetry is worth the detour: the ratio has erased its postwar decline, peaked at 126% in 2020 and stands at 121% in 2025. The temptation to let the nominal "work" again belongs to module 13, on sovereign debt.
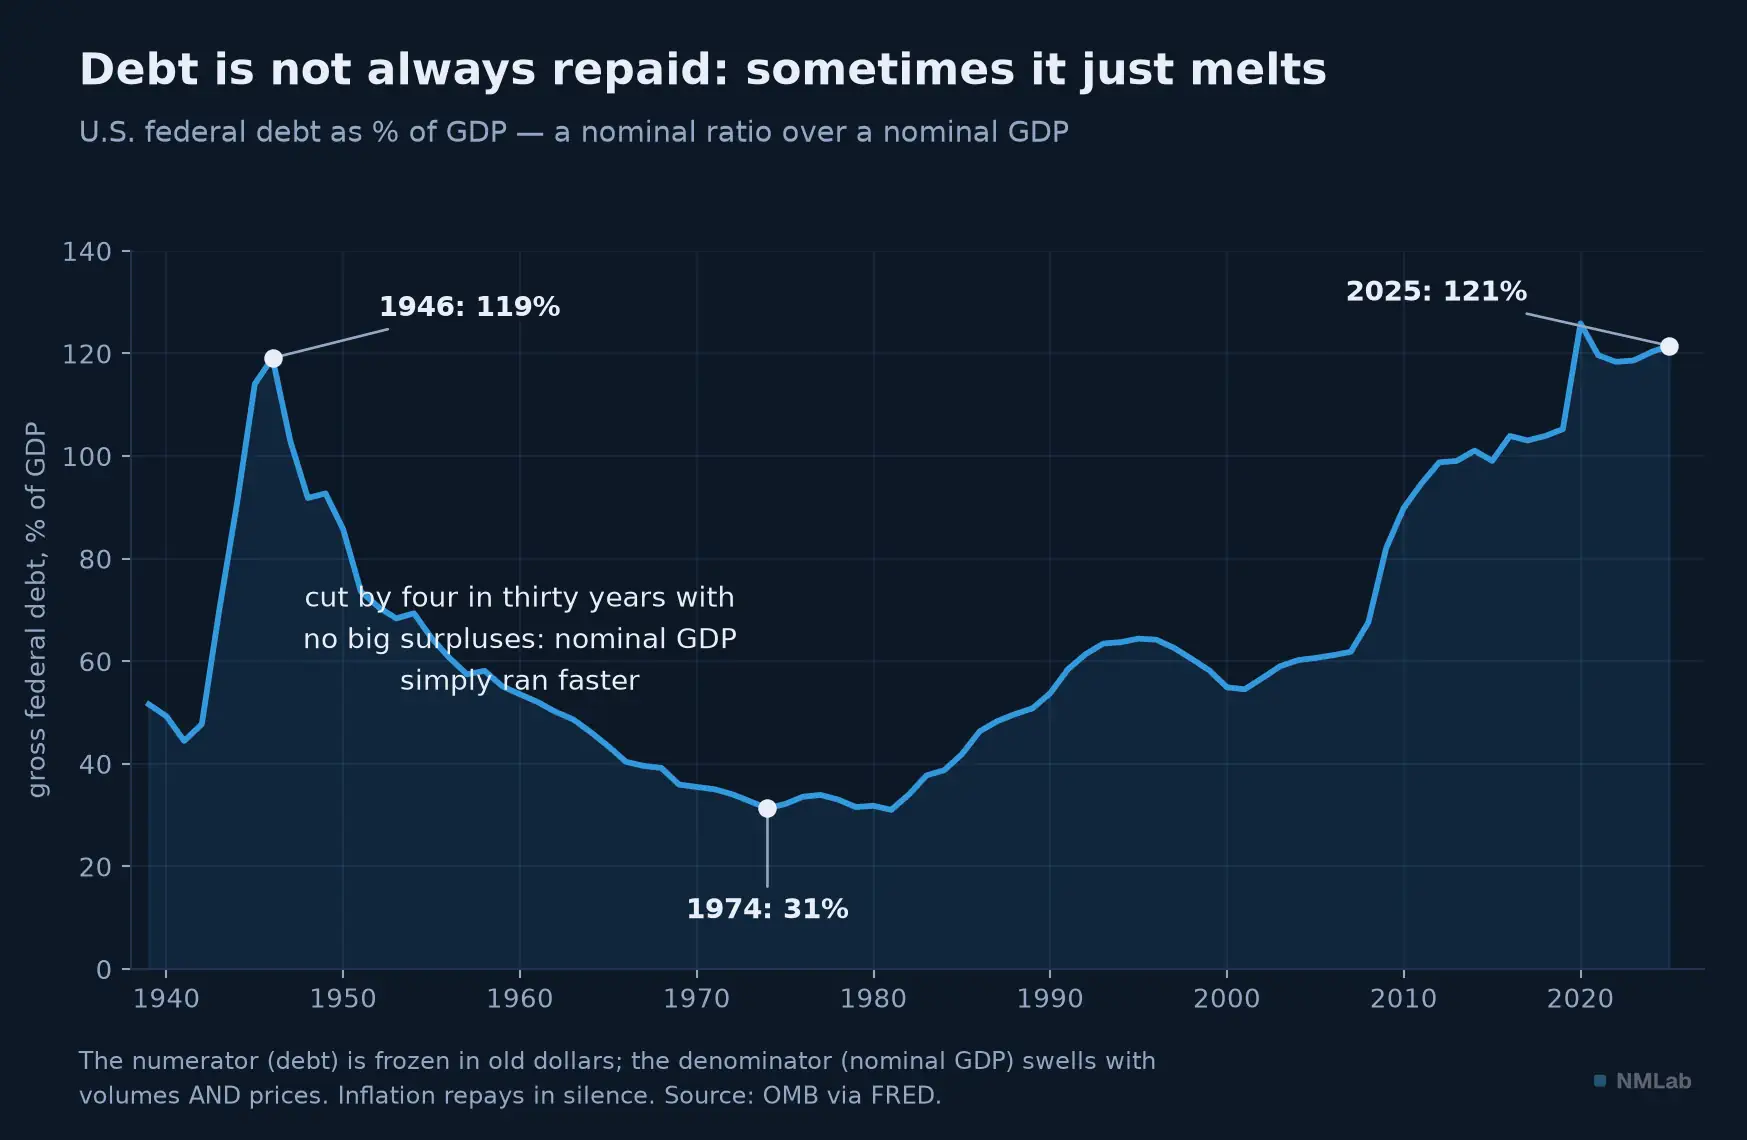
A nominal ratio over a nominal GDP: the postwar debt was not repaid, it was diluted in growth and inflation.
So keep the division of roles: the changes in activity are read in real terms; the levels and the ratios — debt-to-GDP, capitalization-to-GDP, deficit-to-GDP — live in nominal terms. Not because they scale a stock to a flow, but because both of their terms must be denominated in the same currency of the same year: deflating both would leave the ratio unchanged, deflating only one would make it uninterpretable. And the "tide of profits" of the previous chapter follows nominal GDP, at a given margin structure: a high-inflation year can be an excellent vintage for revenues and a mediocre vintage for volumes. Both readings are true; they do not answer the same question.
Money illusion and your investments
If the distinction were natural, this chapter would be useless. It is not: our brain spontaneously thinks in currency, not in purchasing power. Irving Fisher gave this fold a name in 1928 — The Money Illusion — and experimental psychology has confirmed it since: in the reference study by Shafir, Diamond and Tversky (1997), subjects most often rank first the sale of a house at +23% in nominal terms under 25% inflation — a real loss — and dead last the seller at −23% under 25% deflation, who actually books a real gain. The number displayed in money eclipses purchasing power; a 2021 replication found the same ranking, even more sharply.
For the saver, the illusion has a very concrete cost. An investment at 6% a year for twenty-five years turns €100 into €429 — that is what the statement will say, in every case. Live those years with 2% inflation, and those €429 buy the equivalent of €262 of today; with 5%, €127; with 8%, €63. The same statement covers a doubling or an amputation of purchasing power. Hence the only subtraction that matters: real return ≈ nominal return − inflation — Fisher's approximation, him again, to which module 6 will devote a chapter on the interest-rate side.
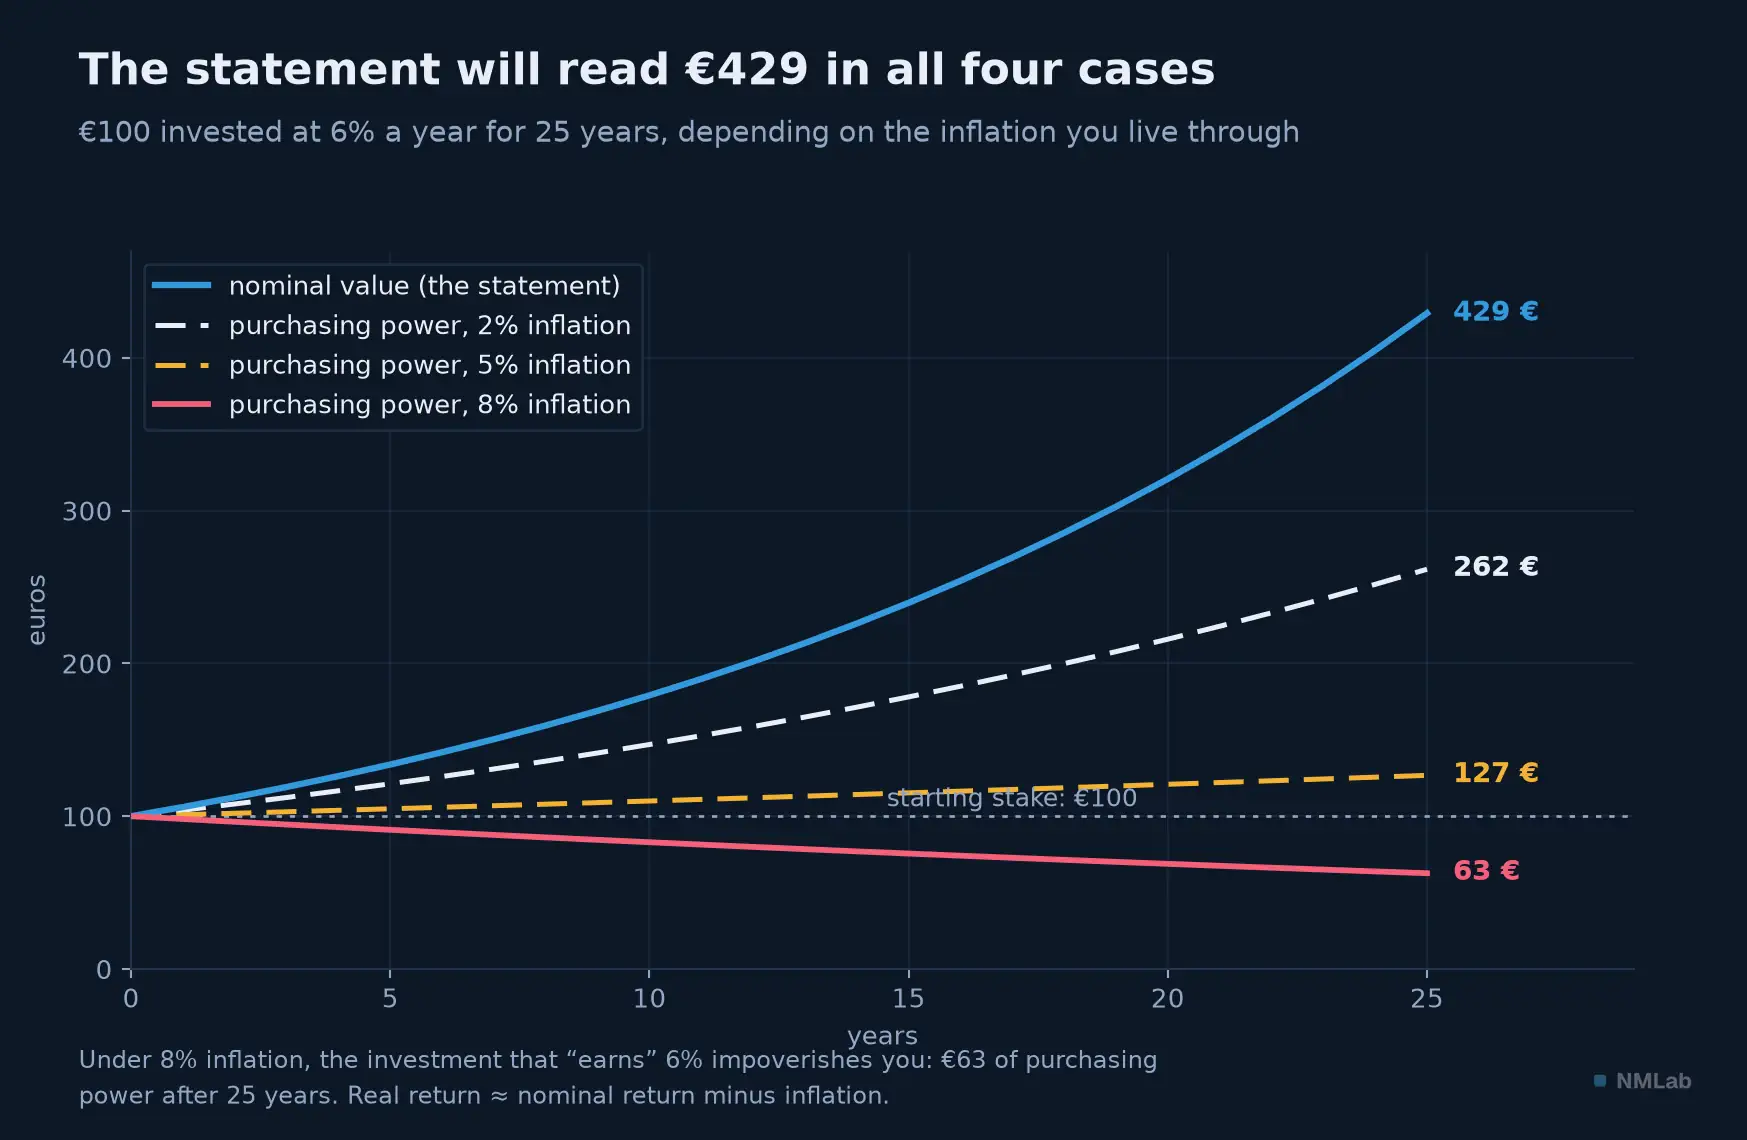
Four scenarios, one statement: under 8% inflation, the investment "earning 6%" impoverishes its holder.
The illusion does not fool only individuals; it has distorted entire markets. The Dow Jones grazes 1,000 points in 1966 and does not settle durably above it until late 1982: sixteen years of nominal standstill during which American prices tripled. The index alone thus loses nearly two-thirds of its real value without ever "falling" — but beware of falling into this chapter's trap in reverse: a shareholder does not hold an index, they collect dividends, then paid at 4 to 6% a year. Reinvested, those bring the era's real loss down to a few percent in total. Telling real from nominal does not excuse you from counting all the flows. In 1979, Franco Modigliani and Richard Cohn diagnosed the mechanics: investors discount real profits with nominal rates — so they undervalue equities when inflation is high, and overvalue them when it is low. Warren Buffett had told the same story to Fortune readers in 1977, under a limpid title: "How Inflation Swindles the Equity Investor." The lesson is not that stocks always protect against inflation, nor never: it is that the error builds up during the regime and is settled when it flips — hence the spectacular returns of the 1980s disinflation, which merely repaid the undervaluation of the 1970s. Module 16 will turn this into an allocation grid.
Reading in real terms: the professional's reflexes
Concretely, in front of a number, here is the routine — five reflexes that fit on a sticky note.
One. Headline growth numbers are already real; no need to re-deflate. Levels, however ("30,762 billion"), and nearly all ratios are nominal. Two. Under high inflation, no nominal quantity is interpretable — not GDP, not revenues, not a stock index. Three. To compare two distant dates, insist on real — or make it yourself: nominal value divided by a price index, within any spreadsheet's reach. On FRED, check the unit in the series title: GDP is in current dollars, GDPC1 in chained 2017 dollars — chapter 18's workshop will have you handle both. Four. Your returns are nominal: subtract inflation before celebrating. Five. Any "real" depends on its deflator: GDP, CPI and PCE do not tell the same inflation story, and choosing the index is part of the analysis — see you in module 4.
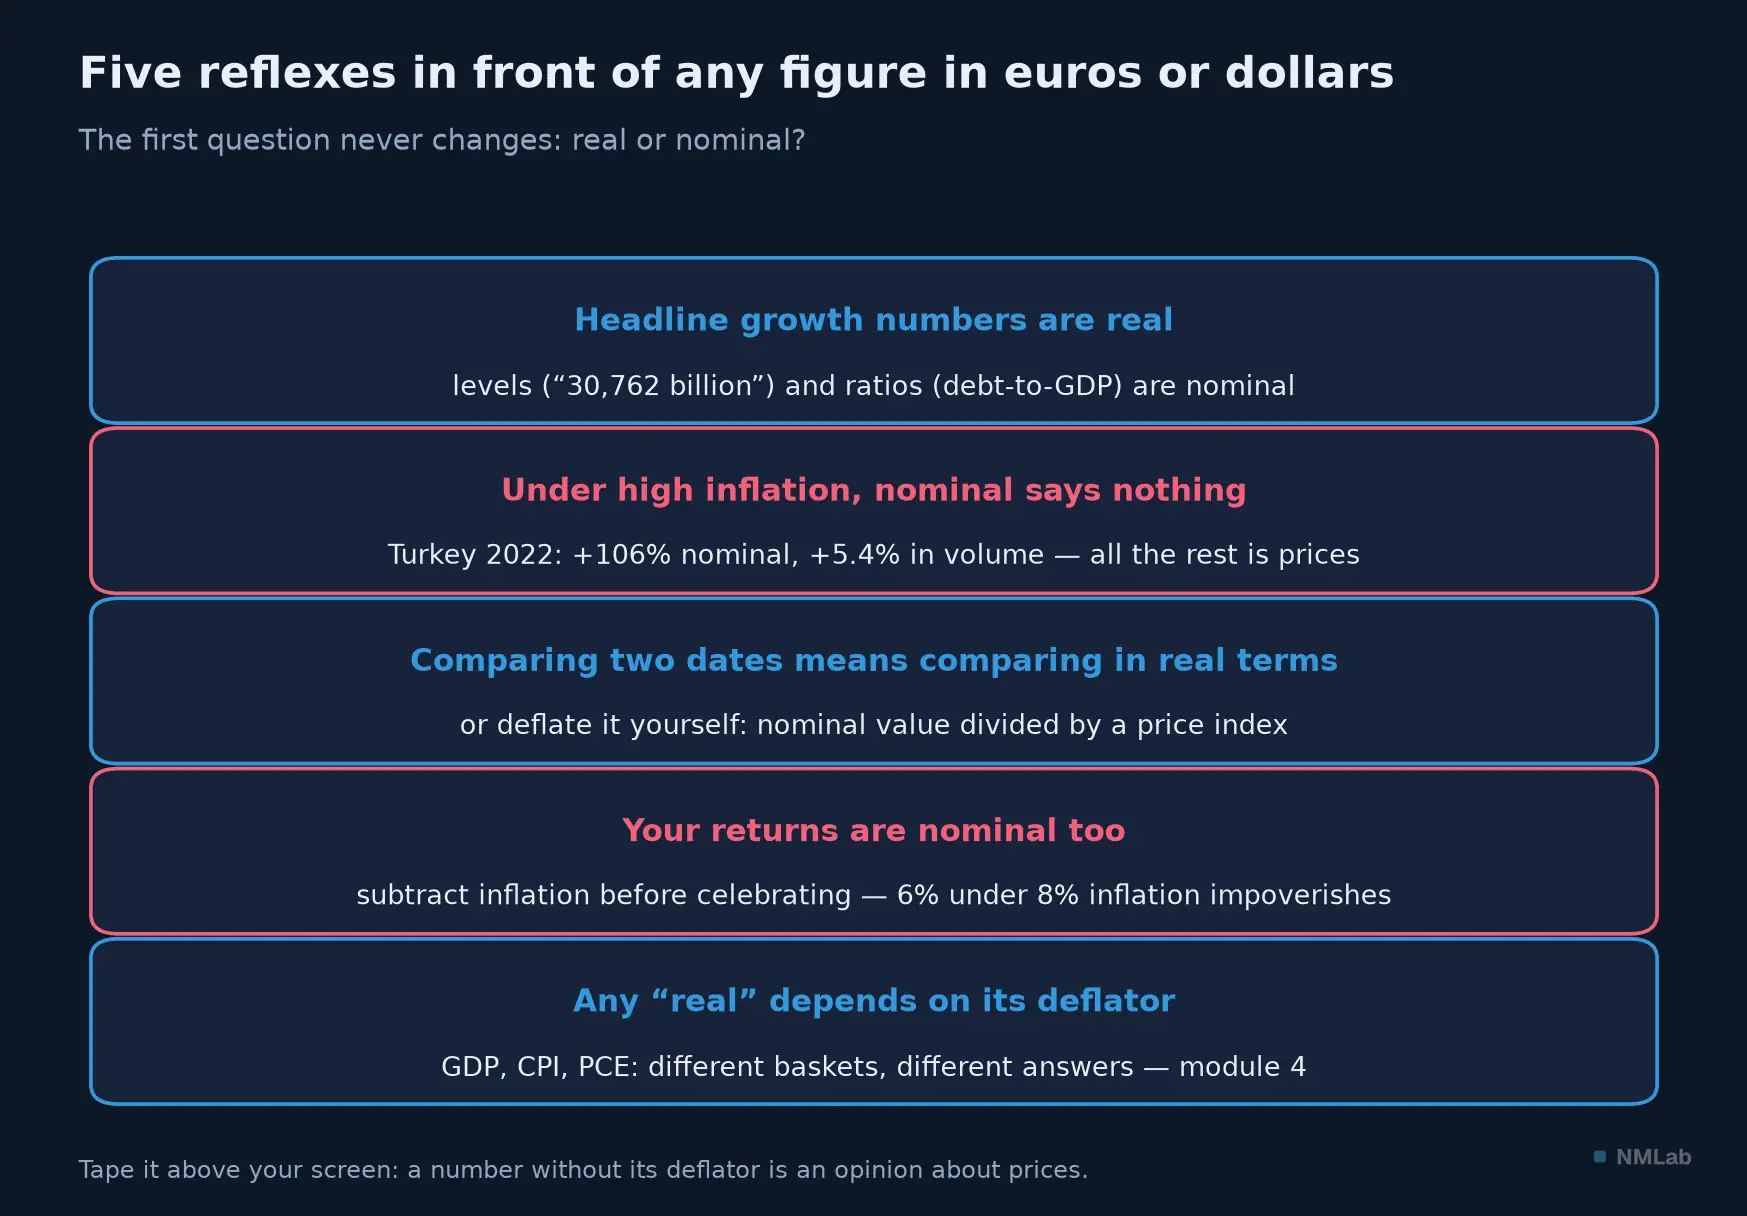
The first question never changes: real or nominal? The four others follow from it.
One last word of humility: real GDP inherits every revision of the nominal, plus those of the deflator. The 1974 recession itself changed its face across vintages. Real is the right map — not the territory.
Key takeaway — Nominal GDP adds up prices × quantities; real GDP freezes prices to track volumes alone; their ratio is the deflator, the economy's broadest price index. Nominal growth ≈ real growth + inflation: in 1974, +8.4% nominal hid −0.5% real; in the Japan of 1995-2015, +3.5% nominal hid +18.5% real. "Volumes" are manufactured with chained indexes, corrected for quality — a construction, and a revisable one. Real judges activity; nominal rules contracts, debts and ratios. And beware of your own brain: it thinks in current euros — subtract inflation, above all from your returns.
The rest of the journey
You now know how to separate volumes from prices — the founding gesture of all macroeconomic reading. The next question flows naturally: those volumes — what makes them grow year after year, and above all, what does that growth pay, or not pay, to your investments? Chapter 9 already planted the doubt with Ritter's negative correlation; time to hear the full case. Next chapter: "Economic growth and its weight on your long-term returns." Until then, a one-minute exercise: take the last economic number that impressed you — a stock-market record, a salary, a house price — and ask yourself whether it is nominal or real. If you cannot answer, you do not yet know what you read — and now, you know how to check.
Sources and further reading
- Gerald Ford, "Whip Inflation Now" address to Congress, October 8, 1974 (American Presidency Project) — inflation as "public enemy number one," delivered in the middle of a recession dated by the NBER from November 1973 to March 1975.
- Irving Fisher, The Money Illusion, Adelphi, 1928 — the book that named the bias.
- Eldar Shafir, Peter Diamond & Amos Tversky, "Money Illusion," Quarterly Journal of Economics, 1997 — the experiment on house sales judged in nominal terms (Adam, Ben and Carl); replicated and confirmed in the Journal of Economic Psychology, 2021.
- Franco Modigliani & Richard Cohn, "Inflation, Rational Valuation and the Market," Financial Analysts Journal, 1979 — real cash flows discounted at nominal rates in the 1970s.
- Warren Buffett, "How Inflation Swindles the Equity Investor," Fortune, May 1977.
- John Maynard Keynes, The Economic Consequences of the Peace, 1919 — confiscation "secretly and unobserved" through continuing inflation.
- J. Steven Landefeld & Robert P. Parker, "BEA's Chain Indexes, Time Series, and Measures of Long-Term Economic Growth," Survey of Current Business, May 1997 — the American accounts' move to chained indexes (the 1996 revision).
- Boskin Commission, Toward a More Accurate Measure of the Cost of Living, 1996 — the +1.1-point-per-year bias of the U.S. CPI.
- William D. Nordhaus, "Do Real-Output and Real-Wage Measures Capture Reality? The History of Lighting Suggests Not," in The Economics of New Goods, NBER, 1997 — two centuries of the price of light.
- INSEE, national accounts in base 2020 (May 2024) — volumes at previous year's prices, chain-linked.
- Figure data: BEA via FRED (GDPA, GDPCA, GDP, GDPC1), OMB via FRED (federal debt as % of GDP), Japan's Cabinet Office via FRED, TurkStat for Turkey 2022 — vintage of July 15, 2026.