11. Economic Growth and What It Is Worth to Your Long-Term Returns
· Updated on · 18 min read
Once upon a time, wrote Paul Krugman in 1994, Western opinion leaders found themselves both impressed and frightened by the extraordinary growth rates of a set of Eastern economies. The press was alarmed. Newsweek warned that the bloc might be "on the high road to economic domination of the world." The director of the CIA, Allen Dulles, told Congress that if industrial growth there "persists at eight or nine percent per annum over the next decade, as is forecast, the gap between our two economies … will be dangerously narrowed."
That bloc was not 1990s Asia. It was the Soviet Union, and the year was 1959.
Krugman's subtitle was three words long: a cautionary fable. And the fable did not stop there. A few pages on, he ran the same arithmetic for Japan: "At the growth rate of 1963-73, Japan would overtake the United States in real per capita income by 1985, and total Japanese output would exceed that of the United States by 1998!" Then, drily: "Well, it has not happened." In 1992, Japanese income per head was still only 83% of America's, and total output 42%.
Krugman was writing three years after the Japanese bubble burst. Japanese GDP peaked at 73.8% of U.S. GDP in 1995 — five years after the crash — before falling to 14.3% in 2024. And the investor who bought the Nikkei at its record close of December 29, 1989 had to wait until February 22, 2024 to see their entry point again. Thirty-four years and two months.
This chapter takes up the case chapter 9 opened with Jay Ritter's negative correlation. The question is simple and the answer counter-intuitive: what, exactly, does economic growth pay the person who invests?
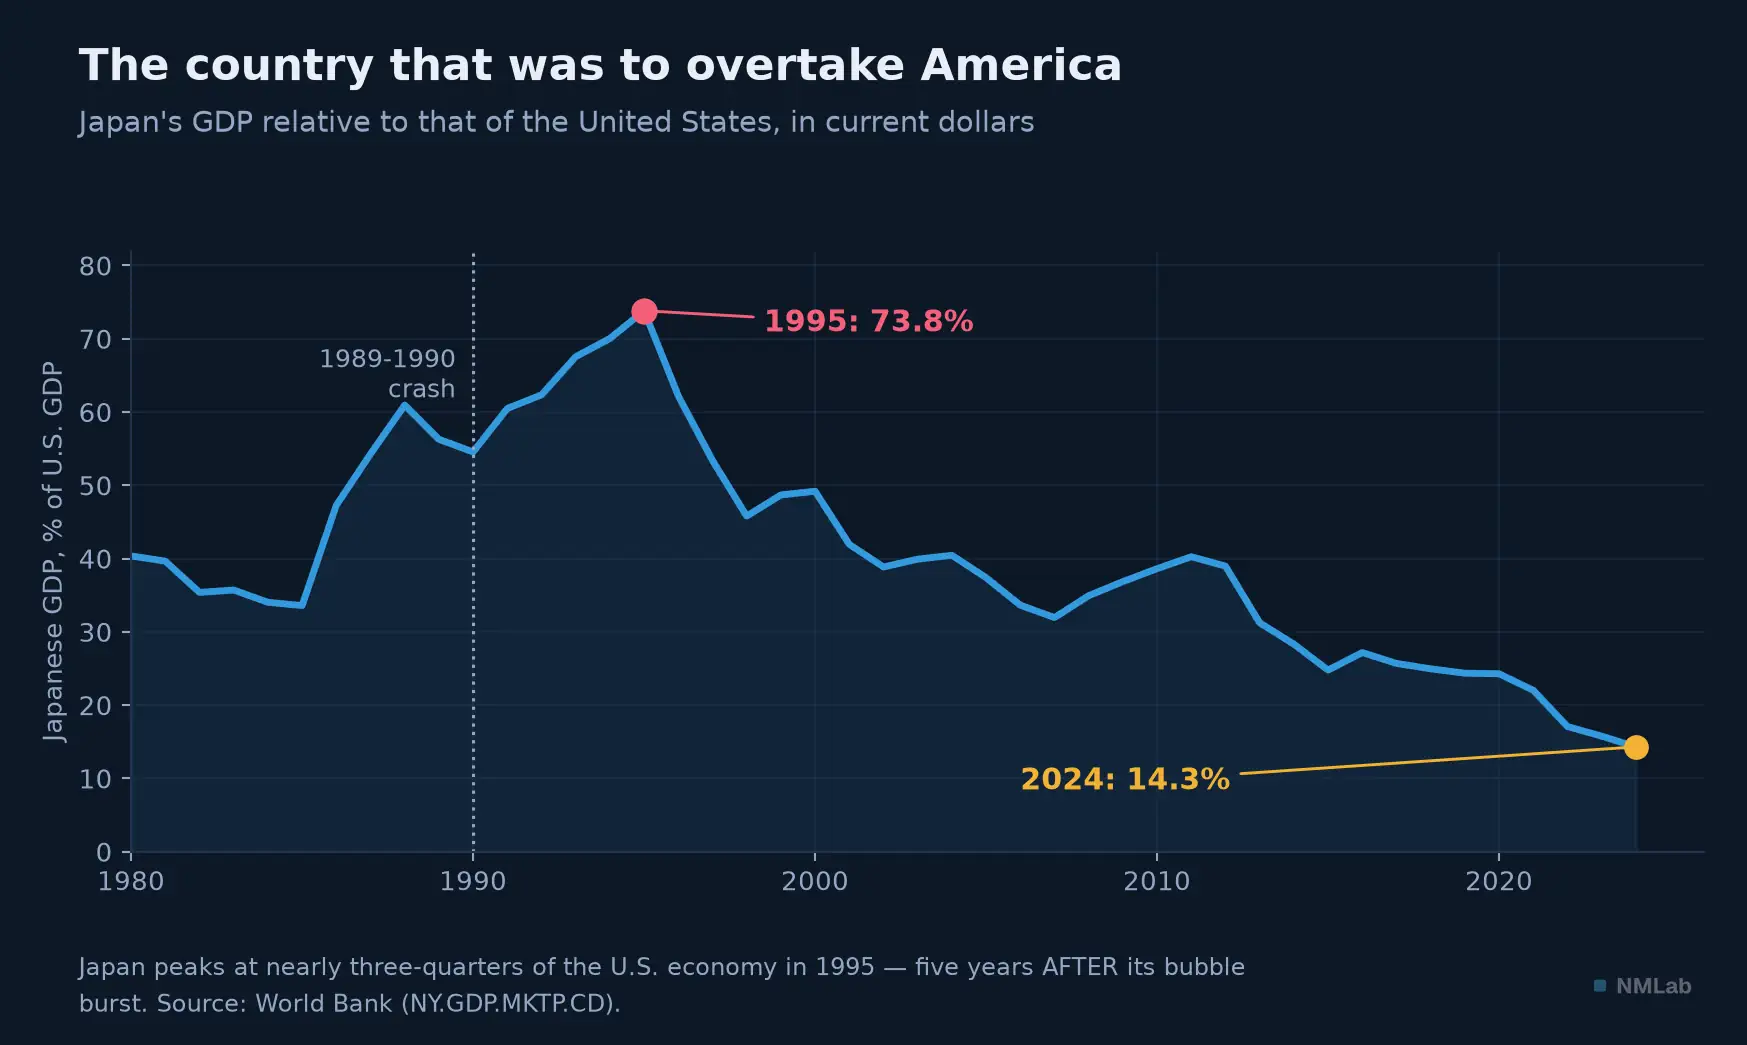
Japan peaked at nearly three-quarters of the American economy — five years after its bubble burst. Past growth says nothing about the next stretch.

At a glance — Level: Advanced · Prerequisites: chapter 9 and chapter 10
By the end of this chapter, you will be able to:
- say where equity returns actually come from — and why two thirds of them come from the dividend;
- explain why growth dilutes, and why the fastest-growing countries have not enriched their shareholders;
- name what growth really determines: the interest rate, rather than your capital gains.
This chapter handles correlations and return decompositions. The passages marked "the detail" can be skimmed: the conclusions hold without them.
The invisible tide
Start with the fact that makes this chapter necessary. Over the past seventy-eight years, the American economy has produced, on average, 3.11% more each year than the year before — in volumes, adjusted for inflation as the previous chapter taught you to demand. Per person, the pace falls to 1.98%. Two modest, almost disappointing numbers. They cover a spectacular enrichment: the average American produced $15,158 of goods and services in 1947; they produce $69,749 in 2025, in the same dollars. 4.6 times more — and in no single year did anyone feel they were living through a miracle.
Hence the first lesson: growth is invisible at the scale we live, and enormous at the scale we age. It is a tide, not a wave. No morning tells you the country got 0.008% richer overnight.
That tide, however, is going out. Trend growth in the United States, as estimated by central banks' benchmark model, has fallen from 3.3% in 1990 to 1.8% in 2022; the euro area's, from 2.7% to 1.0%. Over 2000-2025, the euro area managed just 1.23% a year, and 0.94% per head. This is not a collapse — it is half a point, sustained for thirty years. You are about to see why that is worse than a collapse.
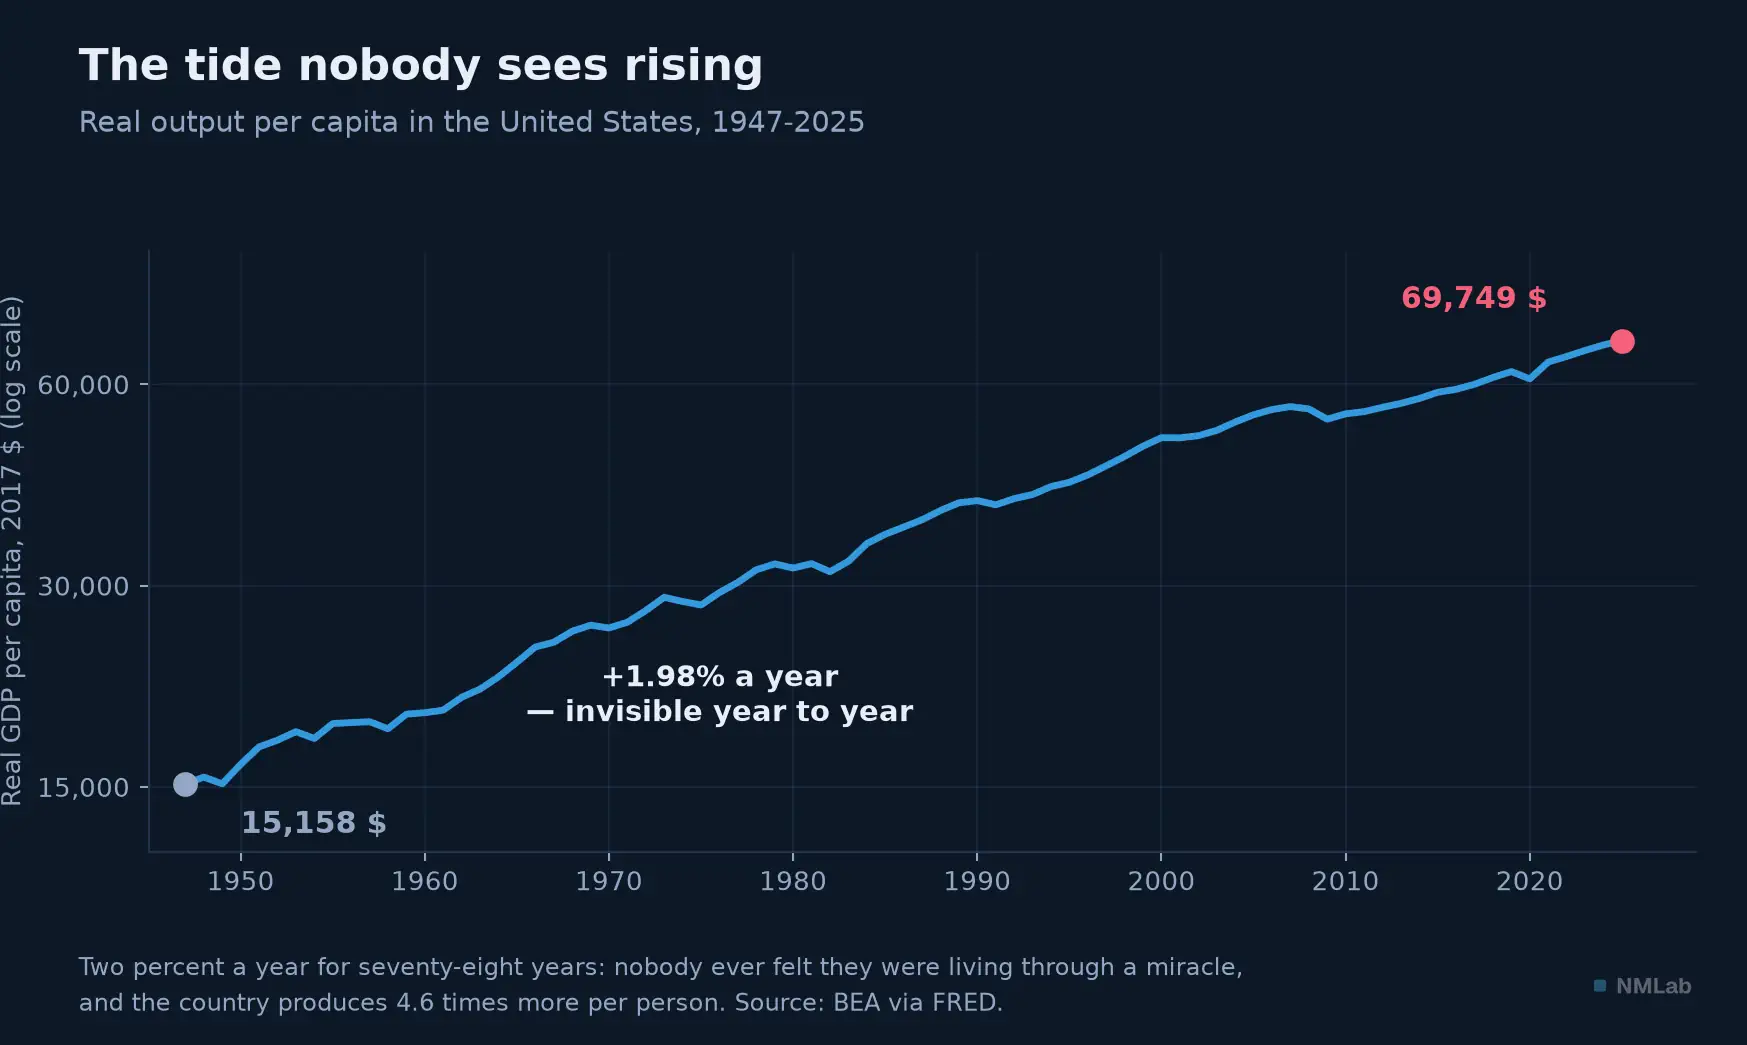
Two percent a year for seventy-eight years: nobody ever felt they were living through a miracle, and the country produces 4.6 times more per person.
Two points of growth, a world apart
Take an economy at 100 and let it run for seventy years — a lifetime. At 1% a year it reaches 201: it has doubled. At 2%, 400. At 3%, 792. One point of difference doubles the outcome; two points almost quadruple it.
The shortcut that lets you work this out in your head is five centuries old. In 1494, in his Summa de arithmetica, the Venetian friar Luca Pacioli — the codifier of double-entry bookkeeping — gives the recipe without proving it: "keep the number 72 in mind, which you will always divide by the interest, and what results, in that many years it will be doubled." At 8%, the rule says nine years; the exact figure is 9.01. At the modest rates of economic growth, the rule of 70 lands even closer: at 2% it says thirty-five years, and the exact figure is 35.0. Keep it: it is the only move that makes compounding intuitive.
This is why economists agonize over decimals that look trivial. When the public debate pits 1.2% against 1.7% of potential growth, it is not arguing about bookkeeping: it is arguing about your children's standard of living. Which leaves the question you care about: does this tide lift your portfolio?
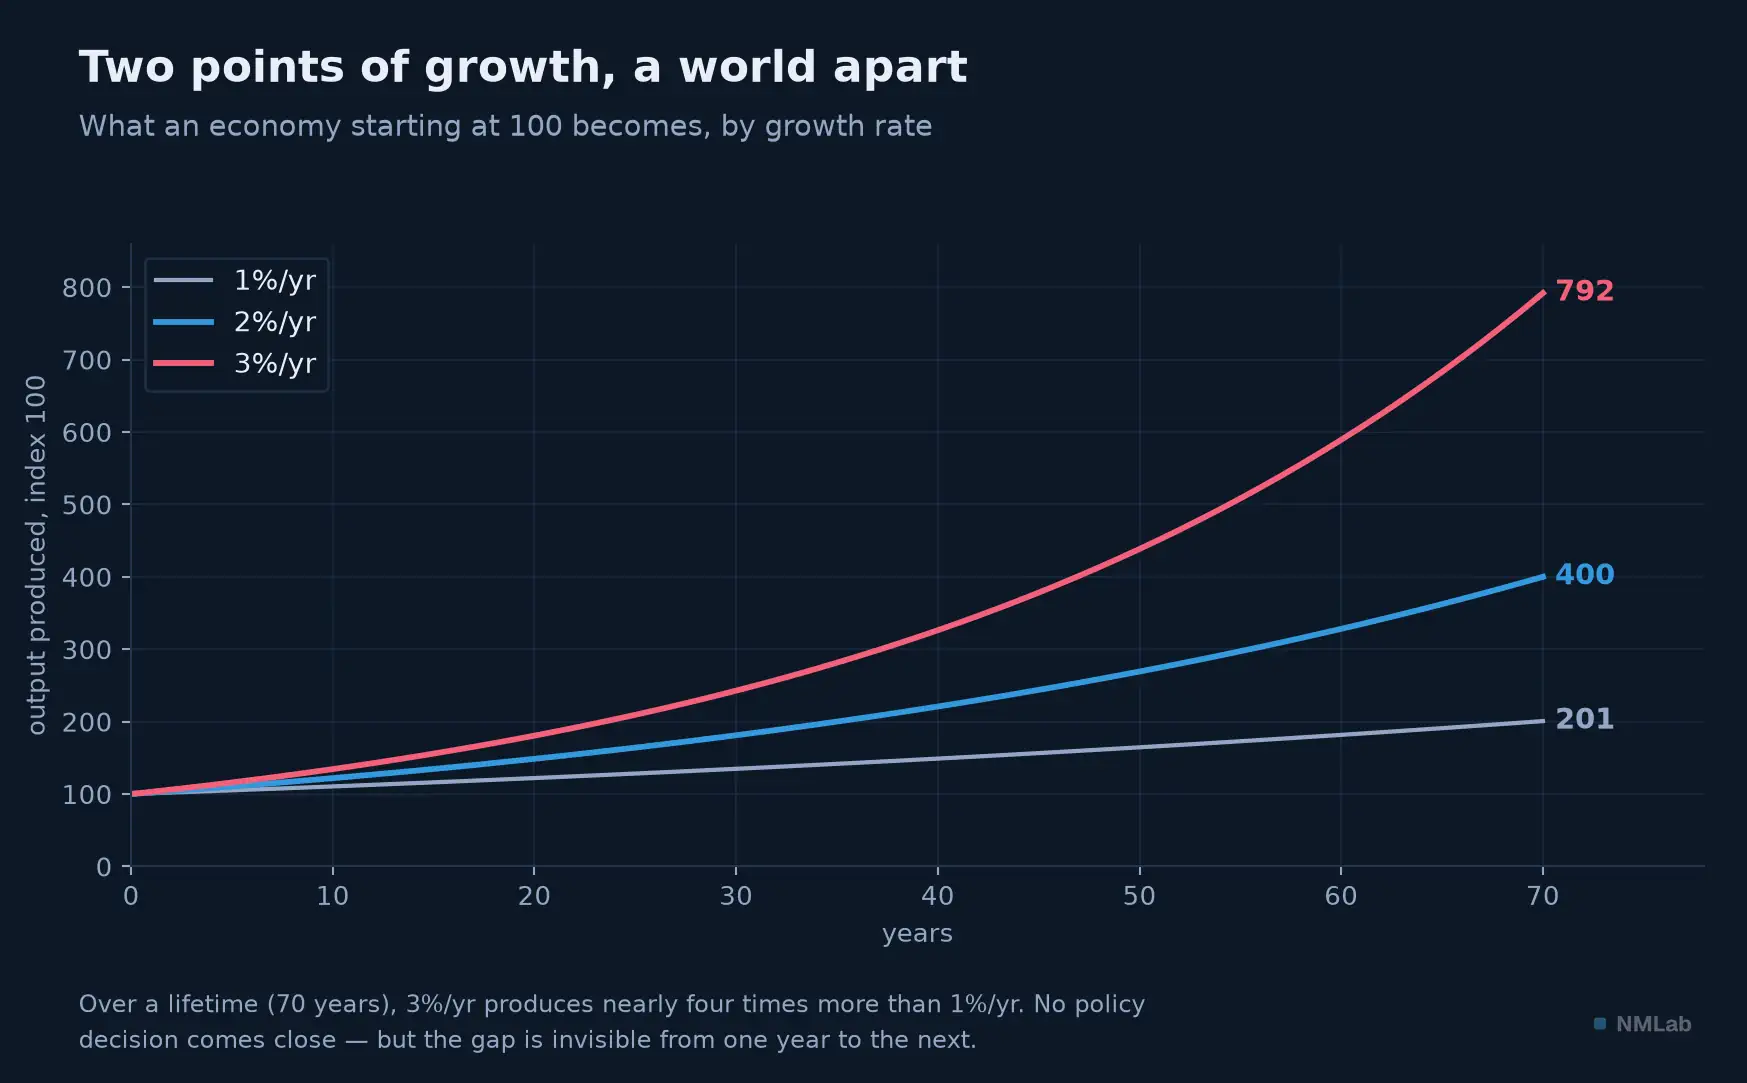
Over a lifetime, three percent a year produces nearly four times more than one percent. The gap never shows up from one year to the next.
Where equity returns actually come from
Let us open equity returns the way chapter 9 opened GDP. Over one hundred and twenty-four years (1900-2024), U.S. equities returned 6.65% a year in real terms, dividends reinvested. Where does that come from? From three sources, and three only:
- the dividend the company pays you: 4.03 points a year on average;
- real growth in earnings per share: 1.94 points;
- re-rating of the multiple — the fact that the market pays more for the same earnings today than in 1900, the P/E going from 15.0 to 23.7: 0.37 point.
Add them up: 6.34%. The gap with the 6.65% measured comes from adding what is really a multiplicative process — but the order of magnitude holds. And look at what this decomposition says: nearly two-thirds of a century's return comes from the dividend, not from growth. Multiple re-rating, which everyone talks about, contributes a third of a point a year over one hundred and twenty-four years.
The result overturns the dominant intuition. The long-term shareholder is not paid because the economy grows: they are paid because the company hands them cash, year after year. Growth does less of the work than you think.
A word of caution about a number you will meet everywhere. Dimson, Marsh and Staunton's yearbook, the global reference in this field, reports 6.6% annual real returns for equities since 1900; much of the press has presented it as the world figure. It is the American figure — the chart it comes from is titled "Cumulative returns on US asset classes." The world is nearer 5.2%. A point and a half a year over one hundred and twenty-five years: a fortune, compounded. Mistaking the United States for the world is the most common error in financial statistics.
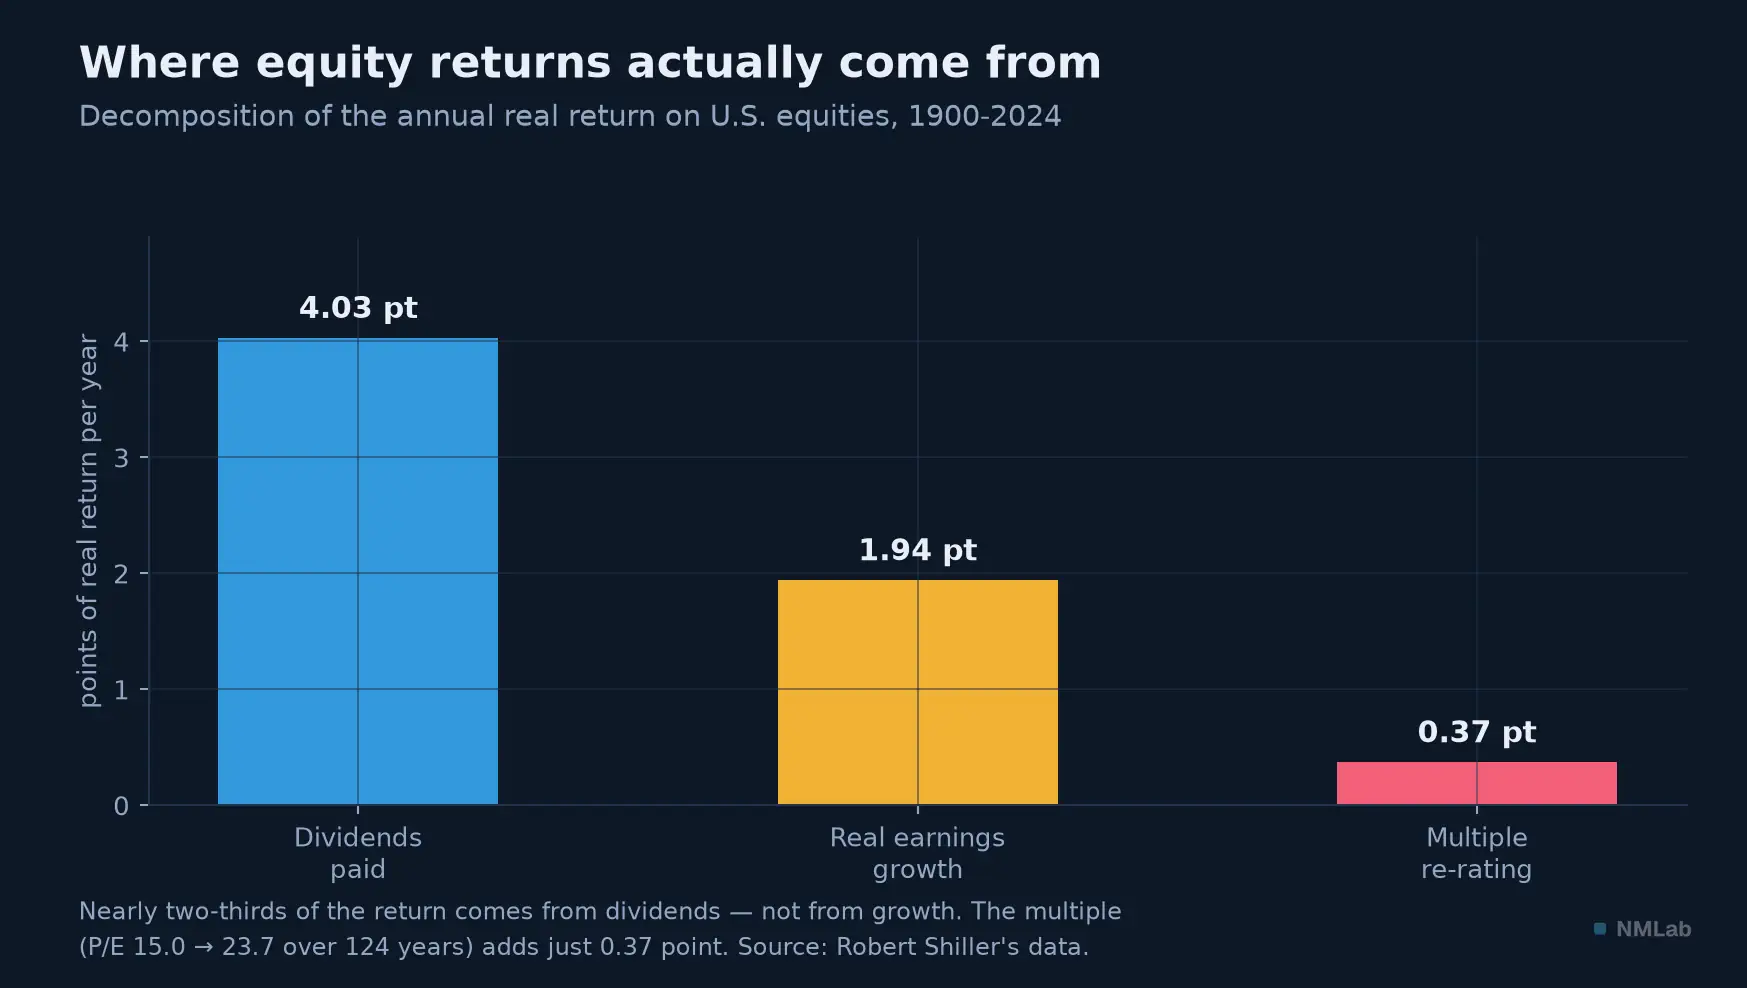
Nearly two-thirds of a century's return comes from the dividend paid, not from earnings growth.
The pie grows, but the slices are recut
That leaves the question of why earnings growth per share is so weak: 1.94% a year when the economy grows more than 3%. A point evaporates somewhere. Where?
Let us measure it. From 1929 to 2023, U.S. real GDP grows 3.19% a year. Real earnings per share, over the same span, 2.22%. The gap — 0.96 point a year — has a name: dilution. It is the least understood mechanism in long-run finance.
William Bernstein and Robert Arnott gave it its definitive formulation in 2003, in an article with a programmatic title — The Two Percent Dilution. Their sentence deserves reading twice: "more than half of aggregate economic growth comes from new ideas and the creation of new enterprises, not from the growth of established enterprises. Stock investments can participate only in the growth of established businesses; venture capital participates only in the new businesses. The same investment capital cannot be simultaneously invested in both."
There is the mechanism, and it is airtight. A growing economy grows by creating firms, not merely by enlarging the ones that exist. Today's Amazons, Nvidias and Modernas were not in yesterday's index — and when they enter, they enter at their price, not as a gift. Add rights issues, shares issued to fund growth, stock compensation: the number of slices rises along with the pie. You can even measure it directly: in the U.S. market through 2001, the capitalization index had grown 5.49 times larger than the price index, implying net new share issuance of 2.3% a year. An index's return measures the slice per share, not the size of the pie.
And now, the most spectacular fact in this chapter. Across the sixteen countries and the century Bernstein and Arnott study, which one's GDP grew fastest? Japan: 4.2% a year, from 1900 to 2000. And what did its dividends per share do over the same century? Minus 3.3% a year. The strongest economic growth in the sample, and dividends per share that fell — a gap of 7.5 points a year, for a hundred years. Averaged across the sixteen countries, dilution runs to 3.3 points against GDP, and 2.4 points against GDP per head. It is heavier (4.1 points) in the nine countries ravaged by war, gentler (2.3 points) in the seven spared — reconstruction is formidable growth, funded by shareholders called back to the till.
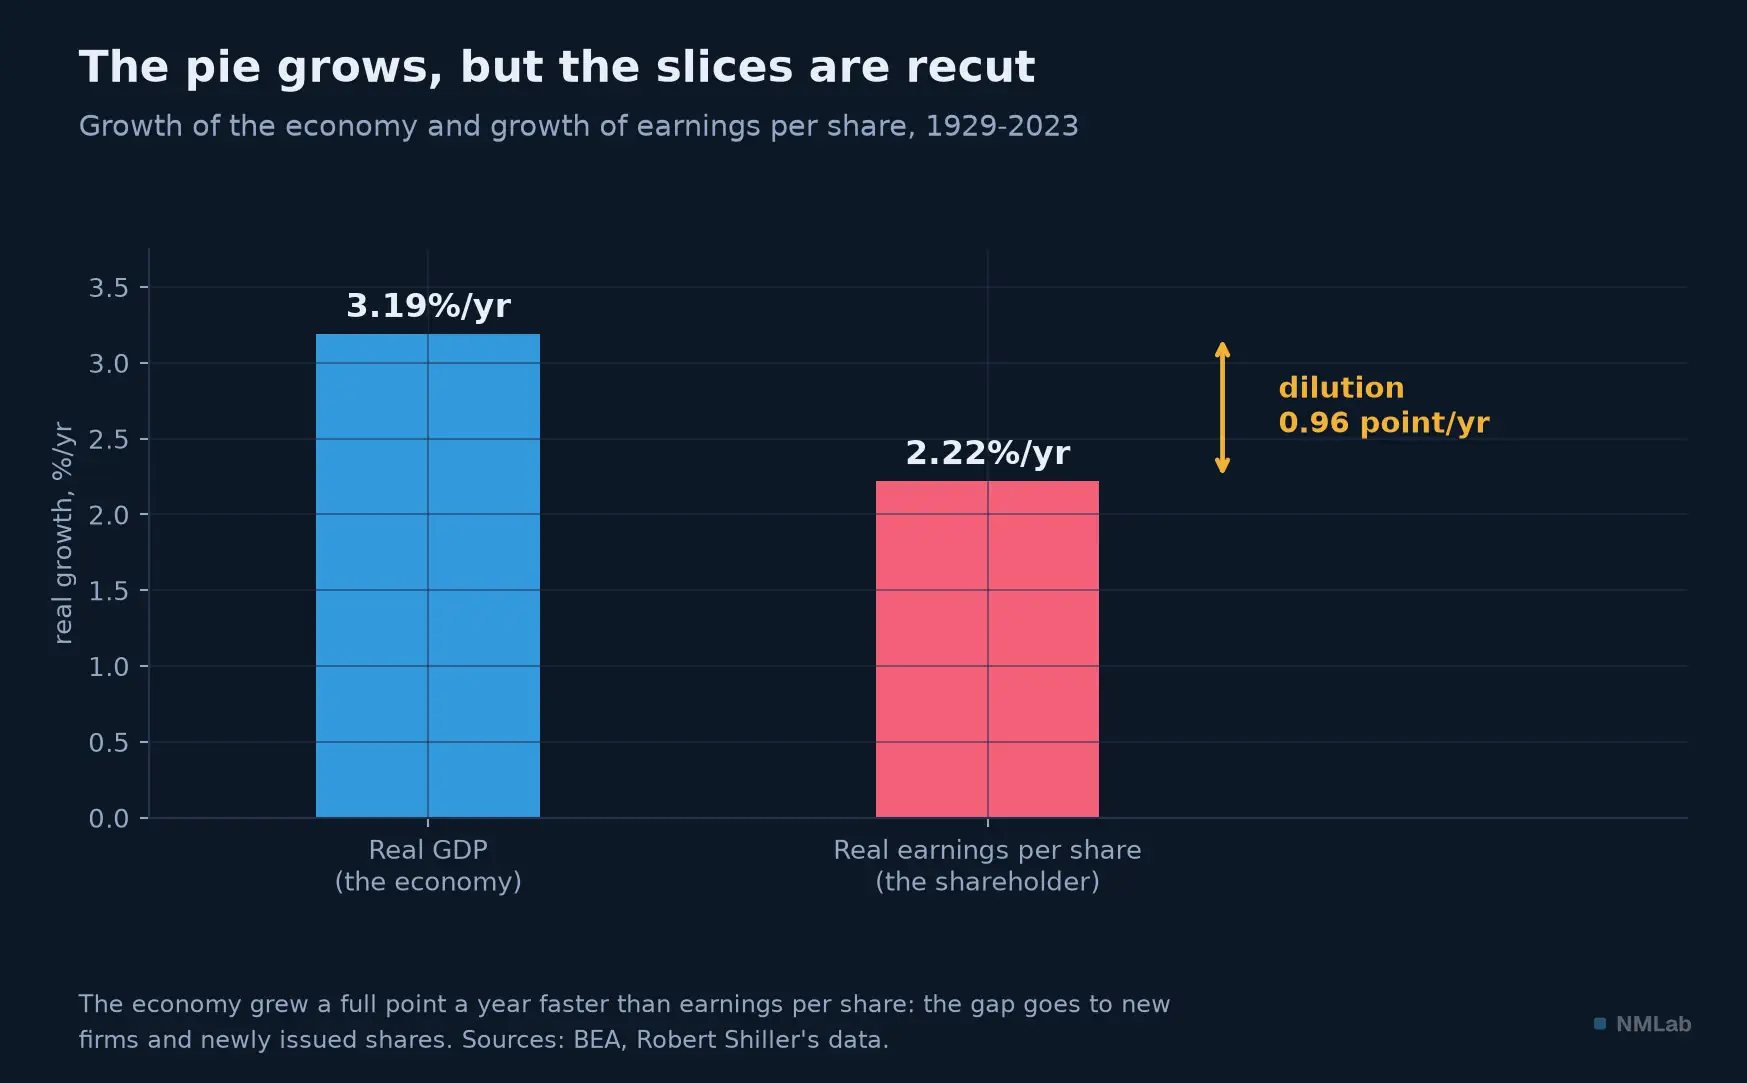
The economy grows a full point a year faster than earnings per share: the gap goes to new firms and newly issued shares.
The missing link
Armed with the mechanism, back to the data — and let us stay in the United States, to dispose of the easy objection that Ritter compares countries too different to compare.
The detail, decade by decade — Nine American decades, 1930 to 2019. For each, real GDP growth and real equity returns. If growth paid, the scatter should rise from left to right. It barely does: the correlation is 0.24 — statistically indistinguishable from zero across nine points. The 1940s show the century's strongest growth — 5.6% a year, courtesy of the war effort — for a mediocre 3.4% real return. The 1930s, the weakest — 1.0% a year, Great Depression included — still left a positive real return, deflation helping. The 2010s: 2.4% growth, among the softest, and 11.4% real returns, one of the best vintages in history. The 1970s: 3.2% growth, −1.4%. The 2000s, finally — weak growth, negative returns, the one point that favors the link — owe everything to the calendar: they open at the top of the dot-com bubble and close at the trough of 2009. The scatter settles nothing, in either direction.
China pushes the demonstration to its limit. From 1990 to 2020, Chinese GDP grew 9.28% a year. Over the same period, the MSCI China index returned 1.30% a year in current dollars, a negative real return, against 9.20% a year for the world index. Along the way it lost 88.6% between 1993 and 2001, while the economy compounded at 9%. Dimson, Marsh and Staunton sum it up: "China underperformed by 1.5% per annum, despite unprecedented growth in real GDP since 1990 of 9% per annum versus 2% for the USA. This is a reminder of the lack of a relationship between long-term GDP growth and stock price performance."
The most elegant test came in 2024, in the Journal of Finance. Franklin Allen and his co-authors split Chinese firms by where they were listed. Same firms, same economy, same 9% growth. Those listed in Hong Kong or New York: +344% in real terms between 2000 and 2018. Those listed in Shanghai or Shenzhen: zero. "Investors in the domestic stock market earned essentially zero net return in real terms." The problem was not Chinese growth: it was the market. Listed companies went from 13 in 1991 to a thousand in 2000, then five thousand; return on assets fell from 13% pre-IPO to just above 6% post-IPO; and few of them pay a dividend — a 0.2% average yield in 2012, against 1.4% for U.S. firms. Industrial-scale dilution, and nothing to distribute.
Three mechanisms explain the disorder, and you know all three. Dilution, which we have just measured. The gap between listed firms and the domestic economy, established in chapter 9. And above all anticipation: Ritter puts it better than anyone — "Realized growth has both an expected and unexpected component. Apparently investors overpay for expected growth, and this overpayment more than offsets the benefits of unexpected growth."
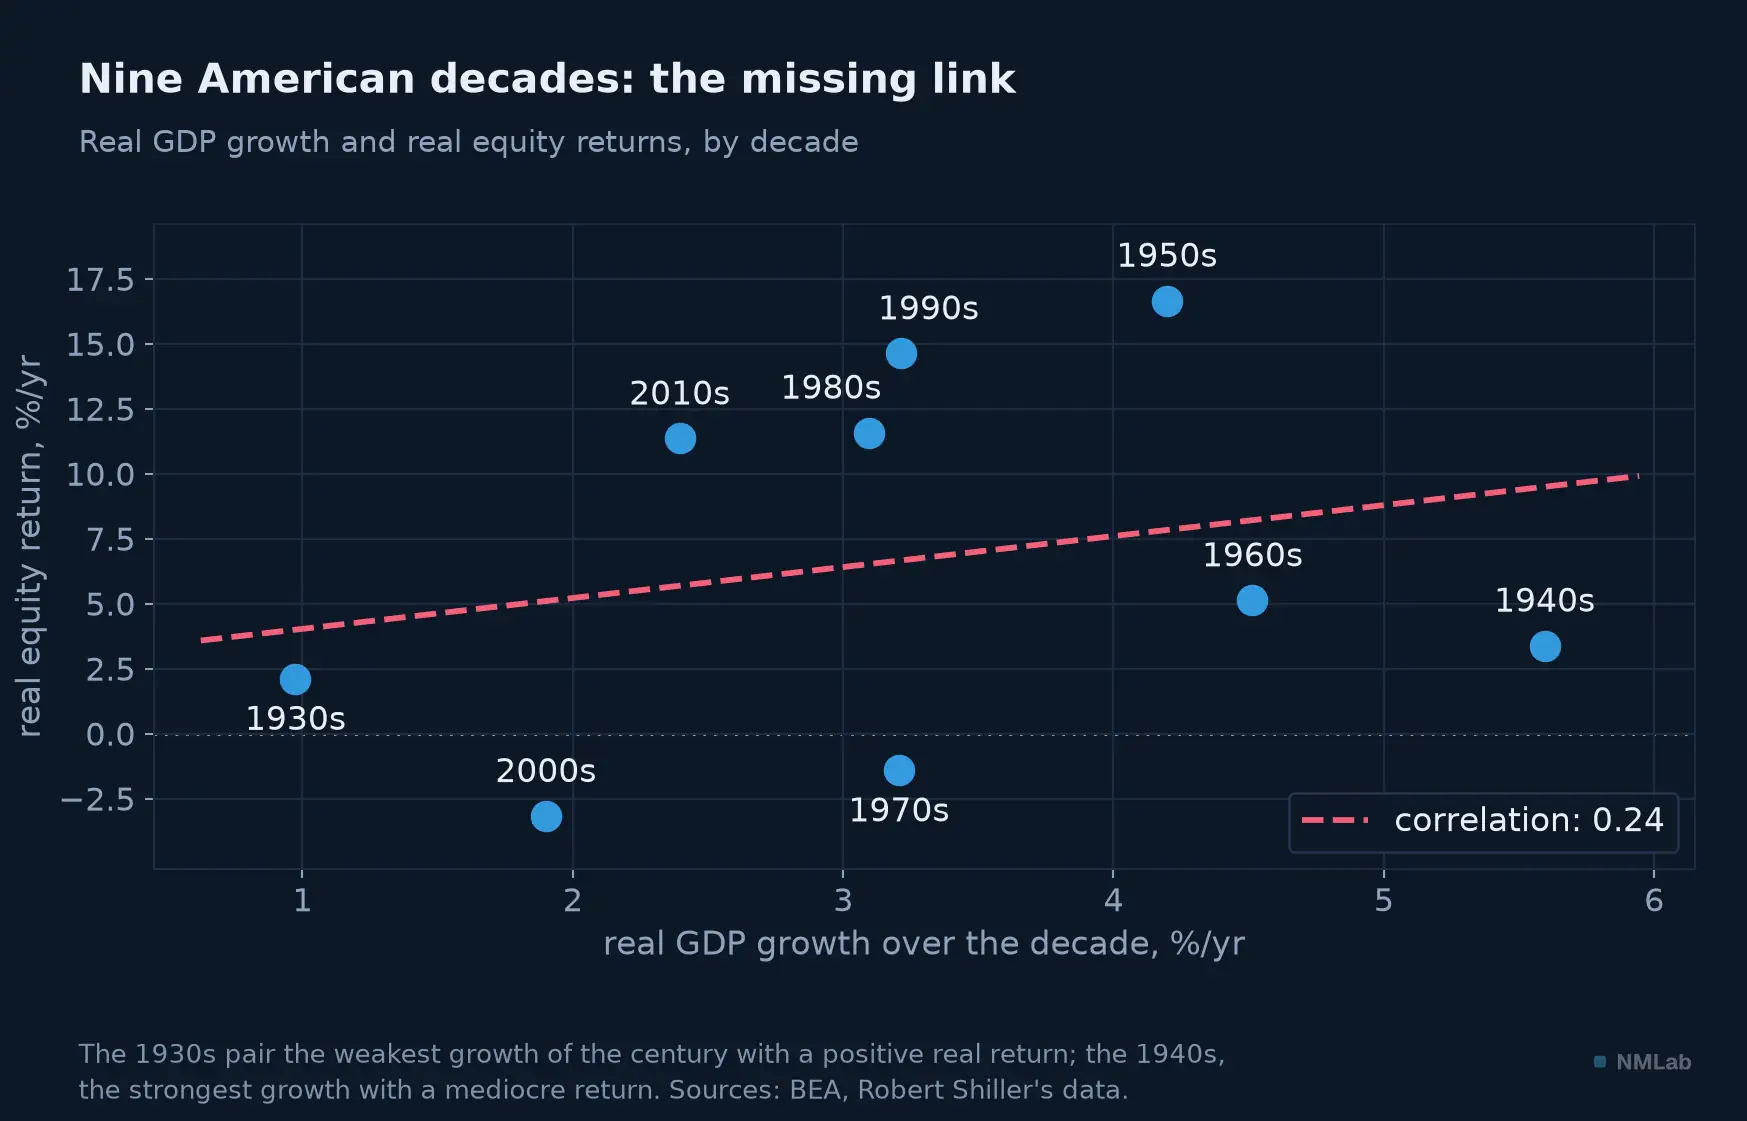
The 1930s pair the century's weakest growth with a positive real return; the 1940s, the strongest growth with a mediocre return.
What growth gives you anyway
Should we conclude that growth is irrelevant to an investor? That would be the precise opposite of the point — and the authors themselves push back on it.
First, because the negative correlation is far more fragile than advertised. None of Ritter's correlations is statistically significant at the 5% level; over 1970-2011 it is −0.04 — that is, zero. The honest formulation is not "growth hurts returns," it is Dimson, Marsh and Staunton's: the lack of a reliable relationship.
Second — and almost nobody reports this — the sign depends on what you measure. Across the same twenty-one countries and the same period, those authors find −0.29 with GDP per capita… and +0.51 with aggregate GDP. Positive, and strong. The difference between the two is demography. And their analogy closes this chapter elegantly: the new shares a company issues dilute existing earnings; "similarly, for a nation with an influx of population, GDP per capita may be enlarged or reduced through the process of sharing the benefits among a larger pool of citizens." Population growth is to a country what share issuance is to a company.
Better: future growth would pay enormously, if you could forecast it. An allocation based on perfect foresight of the next five years' GDP would earn more than 10 points of annualized spread between high- and low-growth countries. "This strategy is sadly not implementable, except by a clairvoyant." What does not pay is not growth: it is past growth, already in the price. One result confirms it: aligning returns with the following year's growth produces a significant positive link. Prices do not follow growth; they precede it.
Finally, growth sets the interest rate, and therefore the price of every asset. In central banks' benchmark model, the natural rate is trend growth plus a residual — with a coefficient fixed at one. Point for point, the equilibrium rate follows trend growth — a far more direct channel than the one running to equities. Growth does not predict what your shares will return, but it largely determines what your bonds will.
One caveat, and it is a dated one. This whole machinery rests on an assumption: that the profit share of GDP is stable. Cornell still wrote in 2010 that "the figure reveals no overall trend." That is no longer true. The share — measured here as economic profits, adjusted for inventory valuation and capital consumption — has gone from an average of 6.1% over 1947-1999 to 9.3% since 2000, and touched its all-time record of 11.47% in late 2025 (the raw measure of chapter 9, without those adjustments, peaks at 12.4% in early 2026). Shareholders have captured, over twenty-five years, well beyond their slice. If stationarity holds over the very long run, that surplus is a loan against future returns.
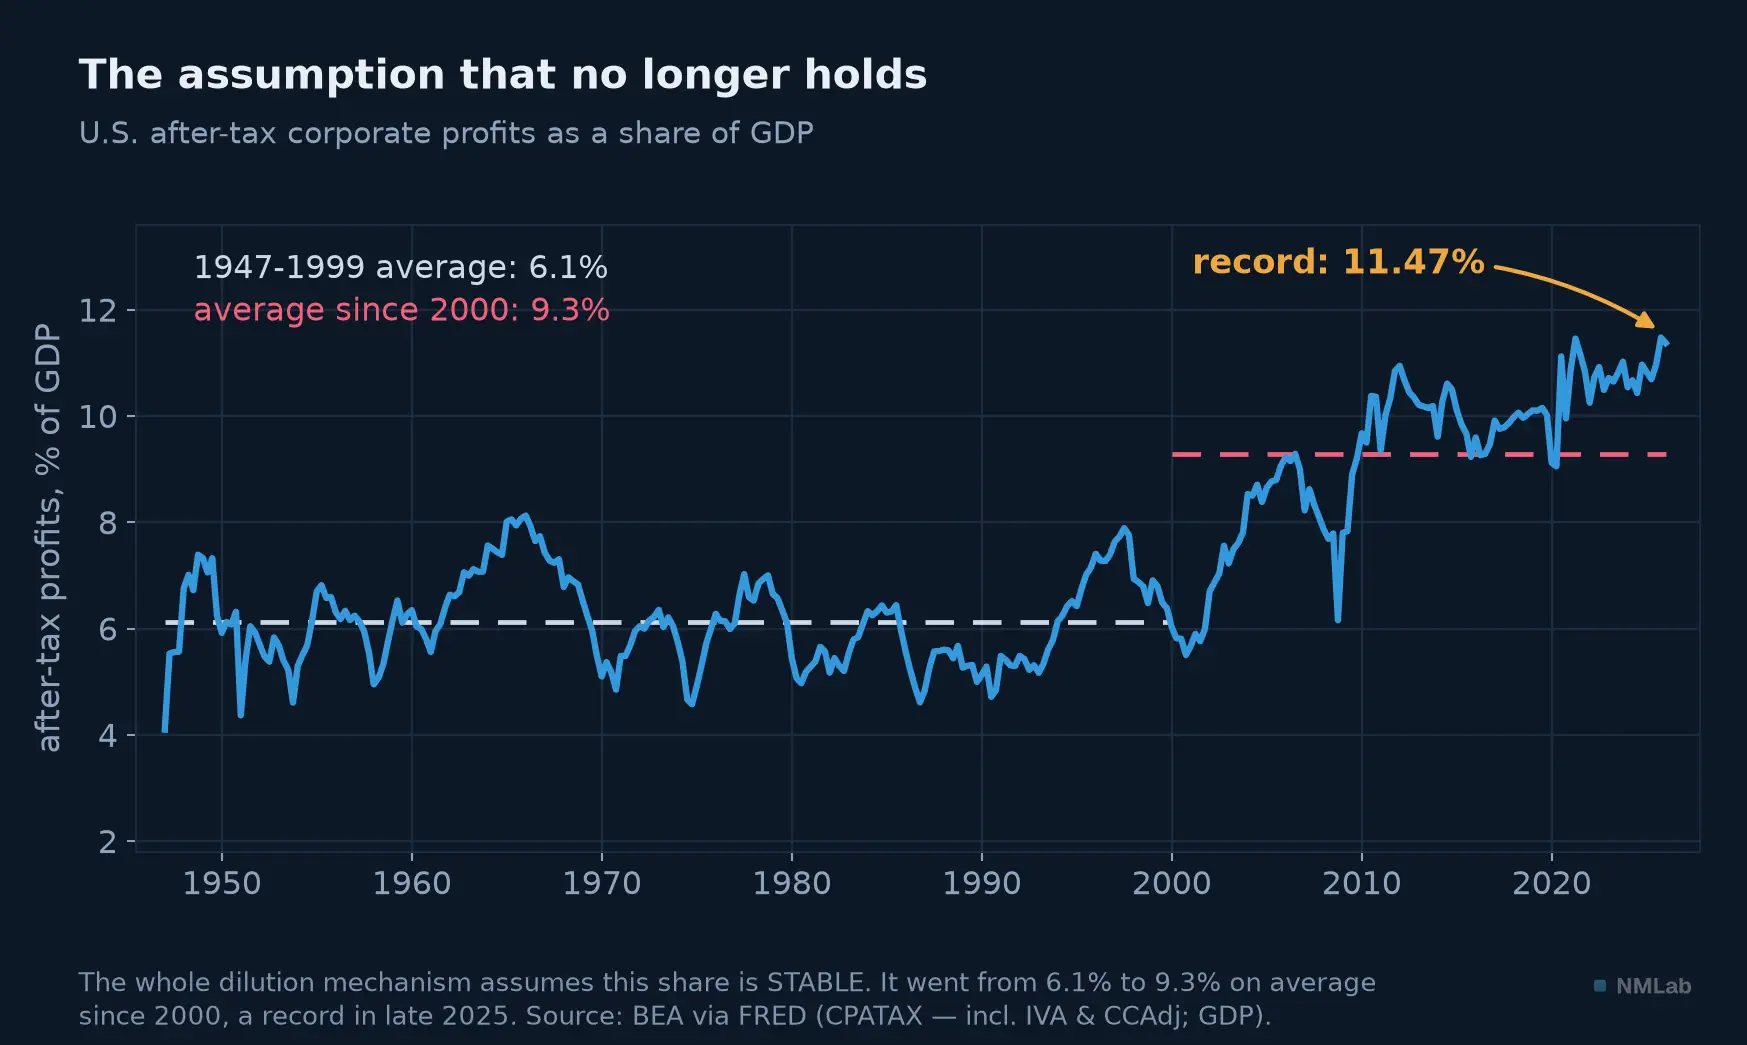
The whole dilution mechanism assumes this share is stable. It has not been for twenty-five years.
And then the essential point. Growth decides the life you will lead — and your portfolio is not your wealth: your human capital, your salary, your home, your pension depend on the tide far more than on your trades. Ritter draws the conclusion that stings: "Apparently, consumers and workers rather than the shareholders of existing companies gain all of the benefits of economic growth." For the investor, that is a disappointment. For the human being living in that economy, it is excellent news.
Key takeaway
- Growth is a tide — 3.11%/yr of U.S. real GDP since 1947, 1.98% per head: invisible each year, decisive over a lifetime ($15,158 → $69,749 per person). But it is going out: U.S. trend growth fell from 3.3% (1990) to 1.8% (2022), the euro area's from 2.7% to 1.0%.
- Compounding does everything — Over 70 years, 1%/yr gives 201, 3%/yr gives 792. The rule of 70 (70 ÷ rate = years to double) turns a rate into a human horizon. Pacioli already stated the rule of 72 in 1494.
- Where the return comes from — Over 1900-2024, the 6.65%/yr real return on U.S. equities breaks down into 4.03 points of dividends, 1.94 of earnings growth, 0.37 of re-rating. Two-thirds is the dividend. And that 6.6% is American, not global: the world is near 5.2%.
- Dilution — Real GDP grows 3.19%/yr (1929-2023), earnings per share 2.22%: a point a year goes to new firms. Japan in the 20th century: the sample's strongest growth (4.2%/yr) and dividends per share falling 3.3%/yr.
- The link is missing — but not reversed — Nine American decades: a correlation of 0.24, not significant. China: 9.28%/yr growth, negative real returns; the same firms listed in Hong Kong return +344%, in Shanghai zero. Beware the symmetrical shortcut, though: the negative correlation is not significant either, it becomes +0.51 with aggregate GDP, and perfect foresight would be worth 10 points a year. What does not pay is past growth, already in the price.
- What it actually does — It sets the interest rate (point for point in central bank models), the long-run tide of profits, and the life you will lead. It does not predict your returns; it describes the world in which they happen.
The journey ahead
You now know what growth does — and does not do — to your portfolio. Which leaves the prior question: where does it come from? We have discussed the tide without ever asking what lifts it. An economy grows durably in only two ways: by putting more people to work, or by producing more per hour worked. The first has limits that chapter 14 will examine. The second has none but our own ingenuity, and it goes by a name that makes people yawn when it should fascinate them: productivity. It is why it now takes eleven minutes to produce what took an hour in 1947. Next chapter: "Productivity and Long-Run Growth: The Variable That Decides Everything". Until then, an exercise: take the last "emerging markets" fund you were offered, and look up its dividend yield. If the sales pitch was growth, you now know which question to ask instead.
Sources and further reading
- Paul Krugman, "The Myth of Asia's Miracle," Foreign Affairs, vol. 73, no. 6, November-December 1994, pp. 62-78 — the Soviet fable, Allen Dulles before the Joint Economic Committee (1959) and the Japanese projection "by 1985."
- Jay Ritter, "Is Economic Growth Good for Investors?", Journal of Applied Corporate Finance, 24(3), 2012, pp. 8-18 — the correlations by period, including −0.04 over 1970-2011; "investors overpay for expected growth"; "consumers and workers rather than the shareholders… gain all of the benefits." Updates Ritter (2005), Pacific-Basin Finance Journal, 13, pp. 489-503, met in chapter 9.
- William J. Bernstein & Robert D. Arnott, "Earnings Growth: The Two Percent Dilution", Financial Analysts Journal, 59(5), 2003, pp. 47-55 — the sixteen-country table, the Japanese case (GDP +4.2%/yr, dividends −3.3%/yr) and net issuance of 2.3% a year. Not to be confused with Robert D. Arnott & Peter L. Bernstein, "What Risk Premium Is 'Normal'?", FAJ, 58(2), 2002, pp. 64-85.
- Dimson, Marsh & Staunton, Triumph of the Optimists, Princeton University Press, 2002; "The growth puzzle," Credit Suisse Global Investment Returns Yearbook 2014, pp. 17-30 — the −0.29 correlation (per capita) against +0.51 (aggregate), the 10-point premium under perfect foresight, the population/share-issuance analogy; Global Investment Returns Yearbook 2023 for China; UBS Global Investment Returns Yearbook 2026 for the U.S. 6.6%.
- Bradford Cornell, "Economic Growth and Equity Investing", FAJ, 66(1), 2010, pp. 54-64 (Graham & Dodd Award) — "unless corporate profits rise as a percentage of GDP, which cannot continue indefinitely, earnings growth is constrained by GDP growth."
- MSCI Barra, "Is There a Link Between GDP Growth and Equity Returns?," May 2010 — the average 2.3-point "slippage" between GDP growth and earnings-per-share growth.
- Franklin Allen, Jun Qian, Chenyu Shan & Julie Zhu, "Dissecting the Long-Term Performance of the Chinese Stock Market", Journal of Finance, 79(2), 2024, pp. 993-1054 — the +344% real return of Chinese firms listed outside China against zero for A-shares; A-share dividend yields below 1% (0.2% in 2012, against 1.4% for U.S. firms).
- Kathryn Holston, Thomas Laubach & John C. Williams, Measuring the Natural Rate of Interest After COVID-19, Federal Reserve Bank of New York, May 19, 2023 — the natural rate as trend growth plus a residual, coefficient fixed at unity.
- Luca Pacioli, Summa de arithmetica, geometria, proportioni et proportionalità, Venice, 1494, fol. 181 — the rule of 72.
- Figure data: BEA via FRED (GDPCA, A939RX0Q048SBEA, GDP; after-tax profits with IVA and CCAdj), Robert Shiller's data (real decade returns, December to December), World Bank (GDP in current dollars) — vintage of July 16, 2026.