25. Money Supply M1, M2: What These Aggregates Really Measure
· Updated on · 15 min read
In the spring of 2021, a chart circulates on financial social media, brandished as evidence. It shows the United States M1 money supply — the measure of instantly spendable money — as a line rising smoothly below 16 trillion. A cliff turned upside down. "Proof," runs the comment, "that the Fed ran the printing press like never before in history." The figure is exact; the interpretation, entirely wrong.
Because that month, the leap created not one single dollar. On 24 April 2020, in the emergency of the pandemic, the Federal Reserve had scrapped an old rule capping "convenient" withdrawals from a savings account at six a month — a distinction rendered pointless once it had cut reserve requirements to zero a month earlier. With a stroke of the regulatory pen, savings accounts became accounts like any other. The statistics followed: the roughly $11 trillion dozing in American savings deposits, until then classified one notch further out, shifted into M1. Nothing was created, nothing was spent: an accounting border moved. The proof: M2, the broader aggregate that already contained those deposits, did not budge by a cent in the process.
That misunderstanding holds this whole chapter together. The previous one handled M2 and M3 as self-evident; it is time to open them up. What, exactly, does each of these letters contain? Why is a savings passbook "money" and a share of stock not? And above all: do these aggregates measure an object of nature, or a convention that can be redrawn one Tuesday morning? The answer — the second — is the thread of everything that follows.
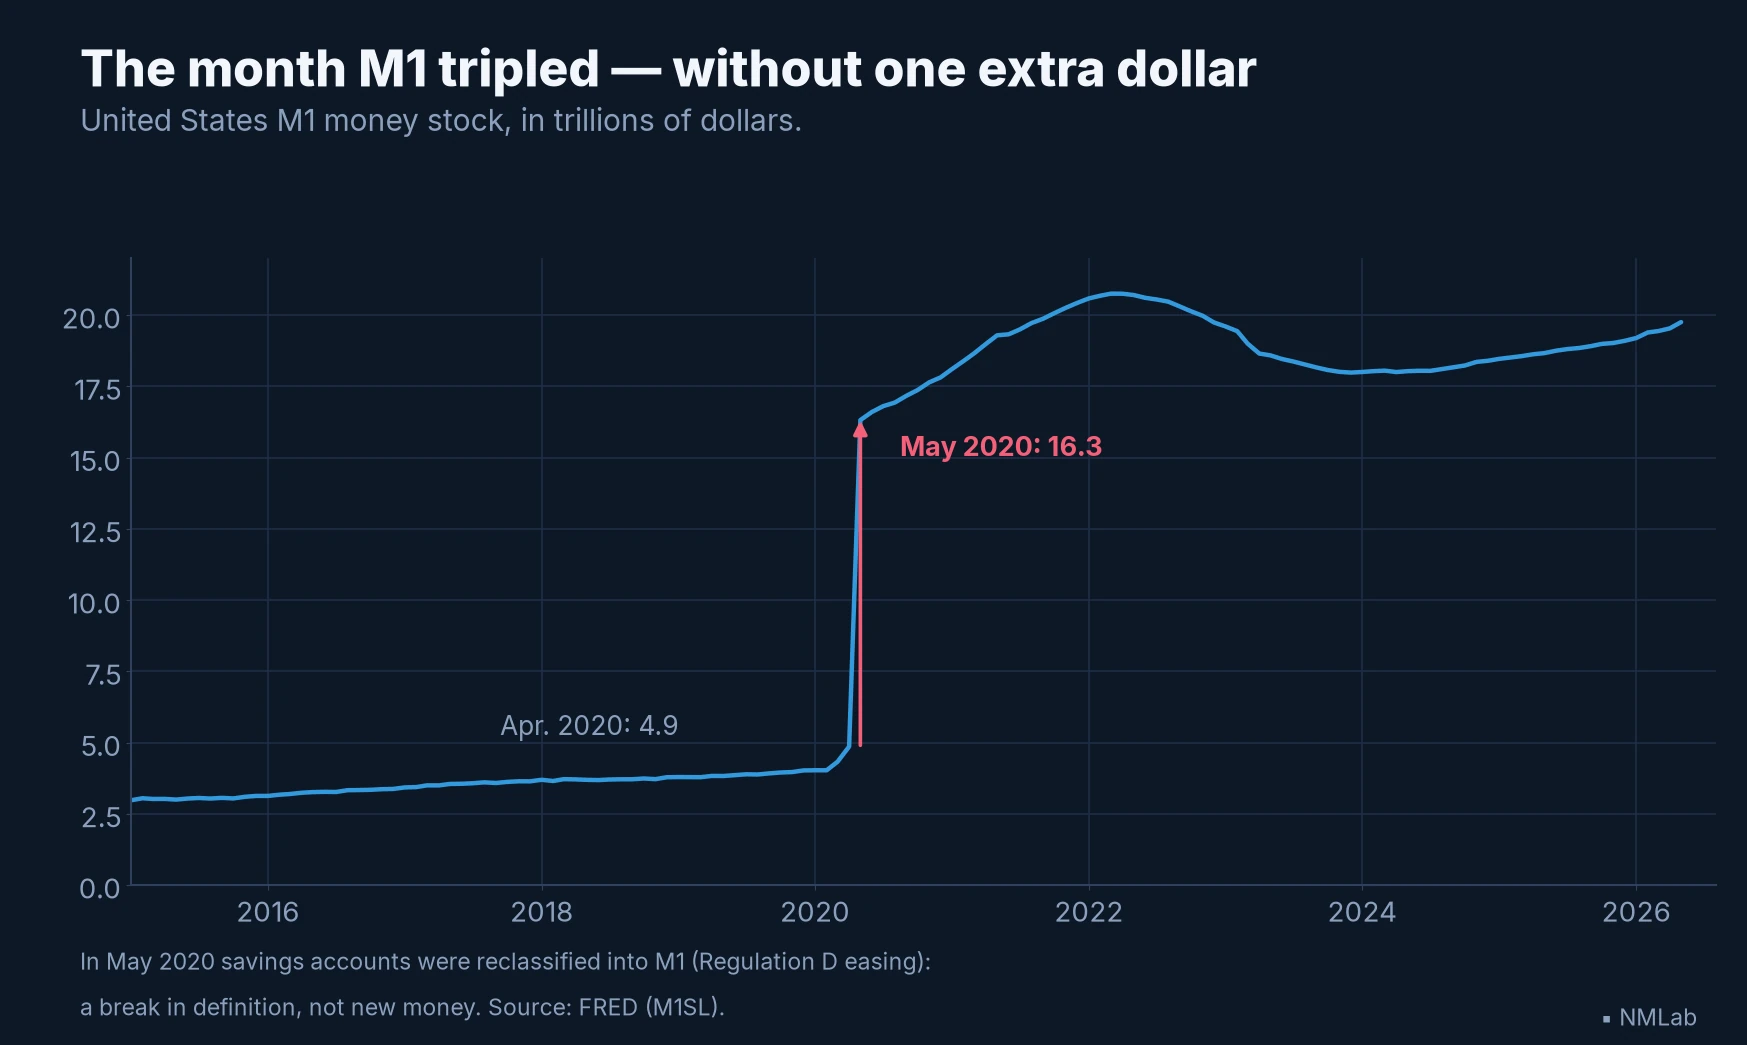
In May 2020 M1 tripled in a month — not through money creation, but because savings accounts were reclassified into it. A break in definition, not in nature.

At a glance — Level: Intermediate · Prerequisites: chapter 21
By the end of this chapter, you will be able to:
- say what each letter actually contains — and why the monetary base does not nest inside M1;
- explain why a savings passbook is money and a share is not, though the share sells in a second;
- spot a change of definition where you thought you saw a movement of the economy.
Ranking money by its liquidity
To understand the aggregates, you must first accept an awkward fact: there is no single definition of "money." The notes in your pocket are money, beyond dispute. The balance of your checking account too — you pay with it. Your savings passbook? Almost: a transfer is enough, but you don't pay the baker directly with it. A three-month Treasury bill? You have to sell it first. A share, a flat? The further you go, the more time, formality and price risk it takes to turn the asset into purchasing power. Money is not a box; it is a gradient.
The criterion that orders this gradient has a name: liquidity, or, in central-bank vocabulary, the degree of moneyness — the ease and speed with which an asset can serve as a means of payment without losing its nominal value. The European Central Bank puts it plainly: a monetary aggregate is the sum of currency plus certain liabilities of financial institutions "which have a high degree of moneyness, or liquidity." Statisticians therefore rank assets from most to least liquid, draw lines where they judge useful, and label each threshold with a letter.
Hence an architecture of Russian dolls for public money: at the core, M1, money spendable at once; around it, M2, which adds short-term savings; wider still, M3, which takes in a few market instruments — each aggregate containing the previous one. The money the central bank issues is not one more doll: as we shall see, it belongs to a different register. That outer shell of assets very liquid but not quite cash is called quasi-money — or near money: essentially, everything M2 or M3 add to M1. The distinction is not arcane; it decides, at each border, what counts as "money supply" and what does not — and therefore what you think you are reading when you follow these figures.
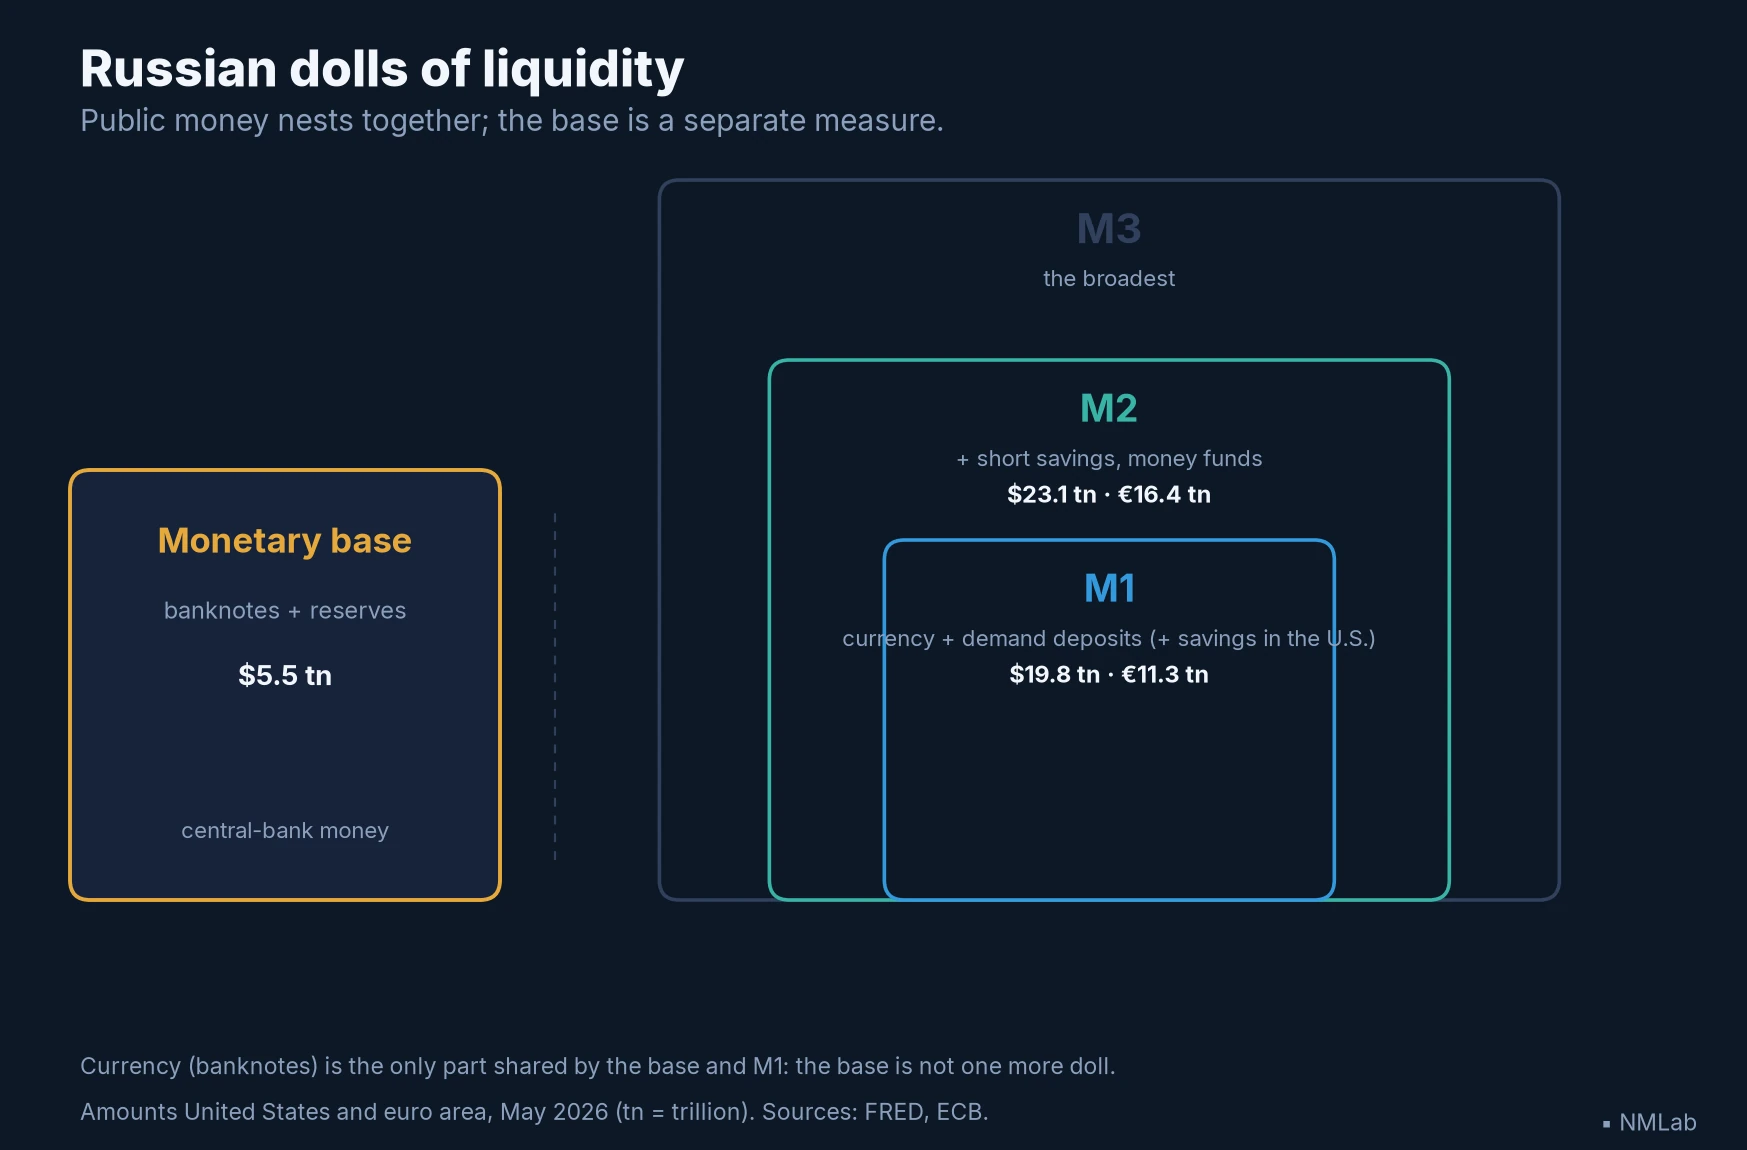
Public money nests like Russian dolls — M1 inside M2 inside M3; the base, central-bank money, stays a separate measure.
What each aggregate contains, in the United States
Let us go into American detail, the most closely watched in the world. Alongside the public's aggregates sits the monetary base — sometimes called M0, though the Fed publishes no aggregate under that name: it releases the monetary base in a separate statement. This is the money the central bank itself issues: banknotes and coin in circulation, plus banks' reserves at the Fed, met in chapter 23. At the end of May 2026, that base was worth about 3,080 billion in reserves. It is the raw material of the system — but chapter 24 showed that it does not mechanically "multiply" into money: it lives mostly at the banks' level, never reaching your pocket. Beware, too, of filing it "under" M1: of the public's money, the base shares only the banknotes — reserves do not enter M1. The base and M1 overlap; they do not nest.
Next comes M1, the public's instantly available money. Since the 2020 overhaul, it brings together currency outside banks — 7 trillion; and other liquid deposits, where the famous reclassified savings accounts now sit, more than 19.75 trillion in May 2026.
One notch further out, M2 adds to M1 two pockets of savings still very liquid but not used to pay: small-denomination time deposits — under 1 trillion — and retail money-market funds, households' cash holdings, some 23.05 trillion. Hold on to the order of magnitude: currency is only a tenth of M2; the overwhelming majority of "money" today is an entry on an account, never a banknote. And since 2020, M1 alone makes up nearly 86% of M2 — a figure that, as we shall see, no longer has much in common with the one before.
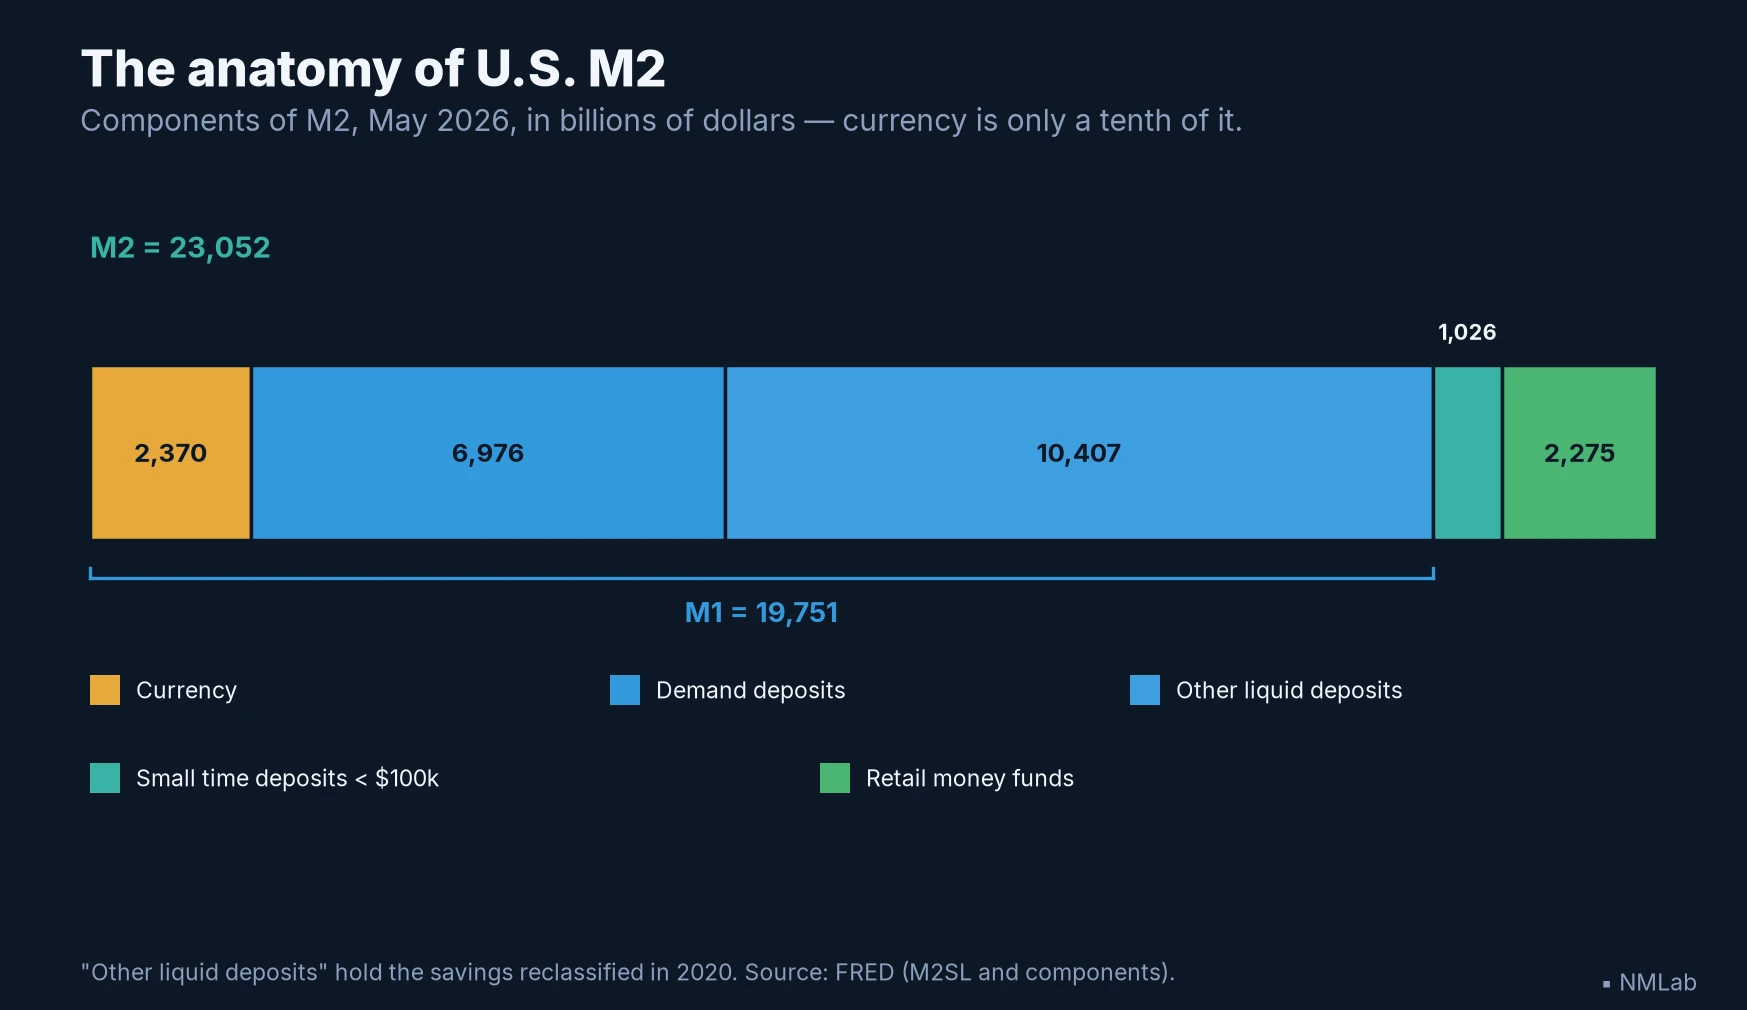
The anatomy of M2: currency is only a tenth of it; the bulk is book money, a line on a statement.
Two continents, two carvings
Cross the Atlantic, and the same letters cover other contents. The European Central Bank defines M1 as banknotes in circulation plus overnight deposits alone — with no savings poured in. M2 takes them in: time deposits up to two years and deposits redeemable at notice of under three months, that is, precisely, passbooks and savings accounts. M3, the aggregate the ECB watches by preference, tops it off with short-term marketable instruments: repurchase agreements (repos), money-market fund shares and debt securities of under two years. At the end of May 2026, the euro area counted some €11,330 billion of M1, €16,380 billion of M2 and €17,550 billion of M3 — three dolls, one and the same money.
The comparison holds a trap every investor should know. American M1 is 86% of its M2; European M1, only 69% of its own. Is Europe half as "liquid"? Not at all: it is a pure artefact of definition. Since 2020, the United States places savings accounts inside M1; the euro area leaves them above, in the M2 layer. The same passbook, the same sleeping savings, falls on one side or the other of the line depending on the continent. Comparing an American M1 with a European M1 is like comparing two rulers graduated in two different units — the classic error of taking the letter for the thing. It is M2, or better still M3 in Europe, that offers the least misleading comparison; and even then, only if you know what each one files where.
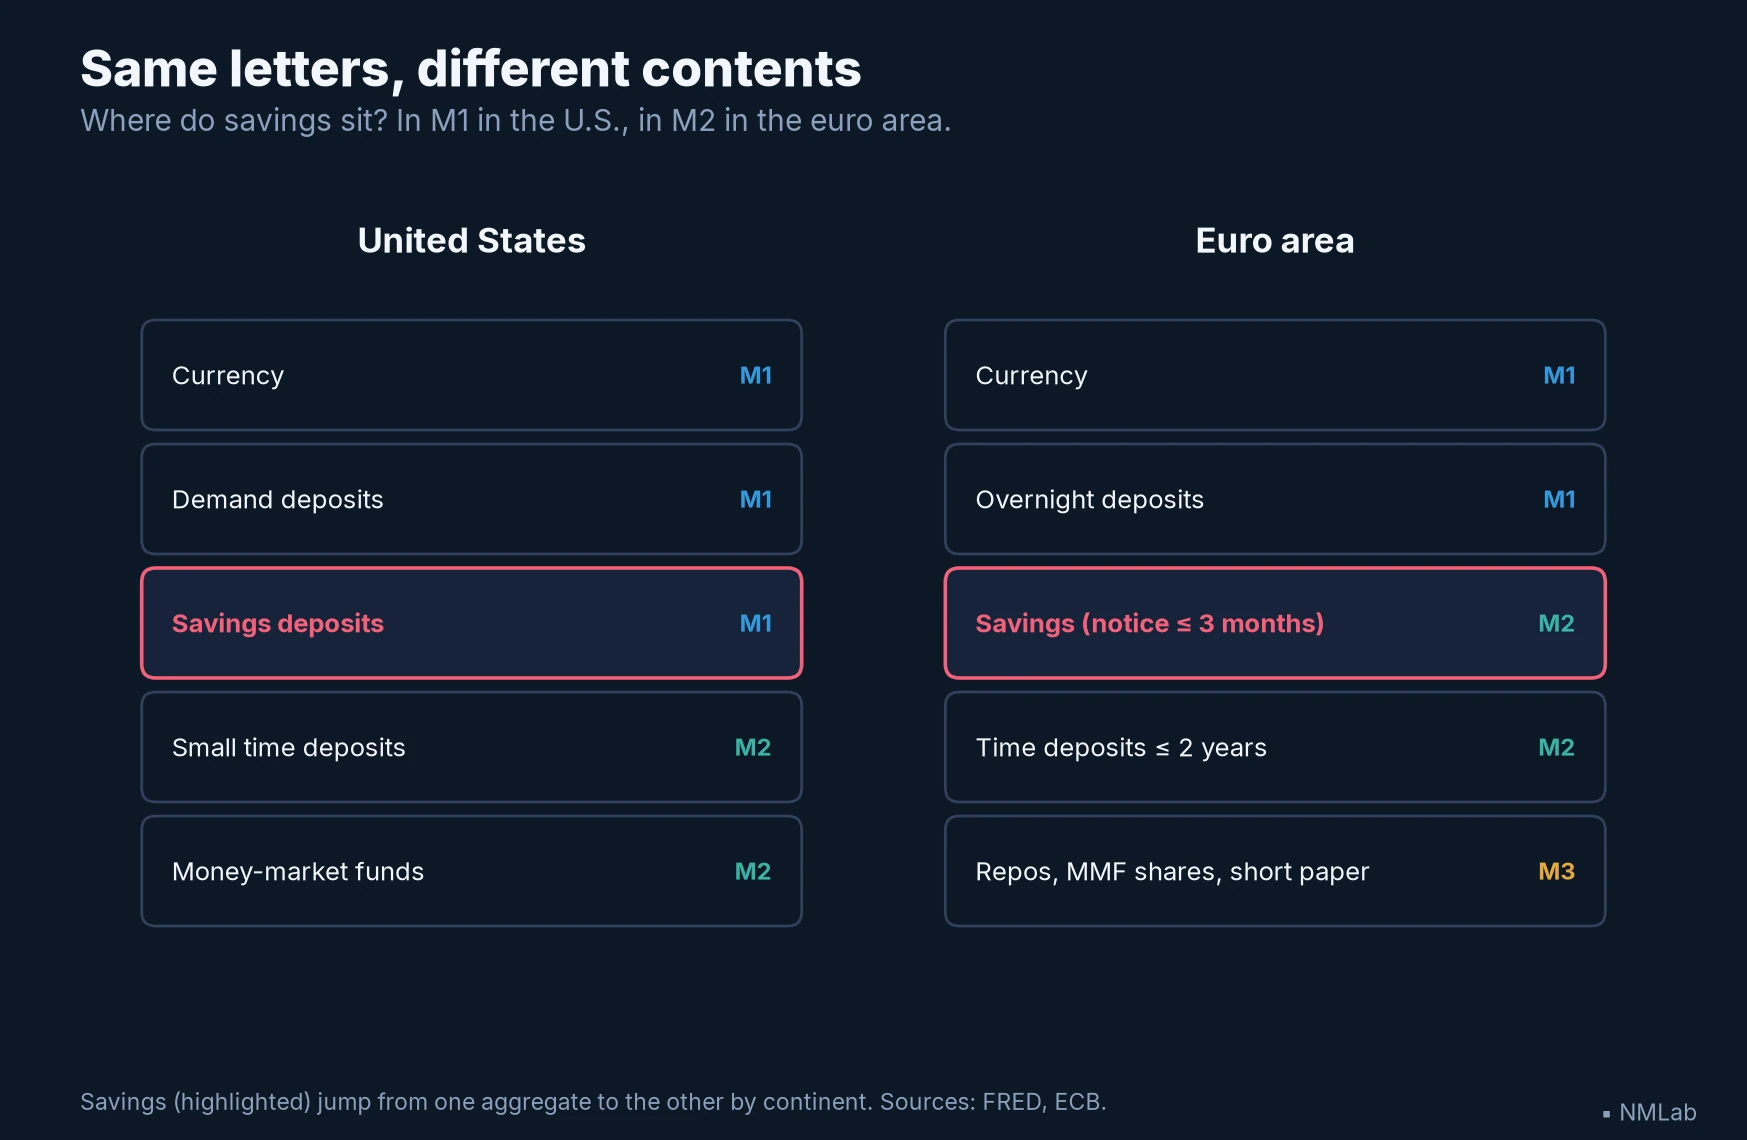
Same letters, different contents: the savings passbook sits in M1 in the U.S., in M2 in the euro area. The letter is not the thing.
Definition is not nature
The 2020 reclassification is no isolated accident; it is only the latest in a long series of eraser strokes on borders once thought carved in stone. The lesson is structural: a monetary aggregate is a statistical convention, periodically redrawn, never a fact of nature.
Go back to the 1990s. From 1994, American banks deploy sweep software that, each night, automatically transfers checking-account balances into savings accounts exempt from reserve requirements, then brings them back in the morning. The customer sees nothing; the statistics, everything. Since those savings accounts did not count in M1, the sweeps artificially depressed measured M1 for years — to the point of making it almost unusable. Money had not changed; its measurement had.
Another eraser stroke, more radical: in November 2005 the Fed announces it will stop publishing M3, which it does on 23 March 2006. The official reason, almost offhand: M3 "does not appear to convey any information about economic activity that is not already embodied in M2," and its collection cost "outweighs the benefits." Overnight, the broadest aggregate of the United States ceased to exist as an official figure — repos, eurodollars and large time deposits wiped off the map. Then came 2020 and the reclassification of passbooks. Three gestures, three decades, one and the same truth: statisticians draw the lines, and can redraw them. Whoever follows an aggregate without knowing when its definition moved sometimes reads a change of rule where they think they see a movement of the economy.
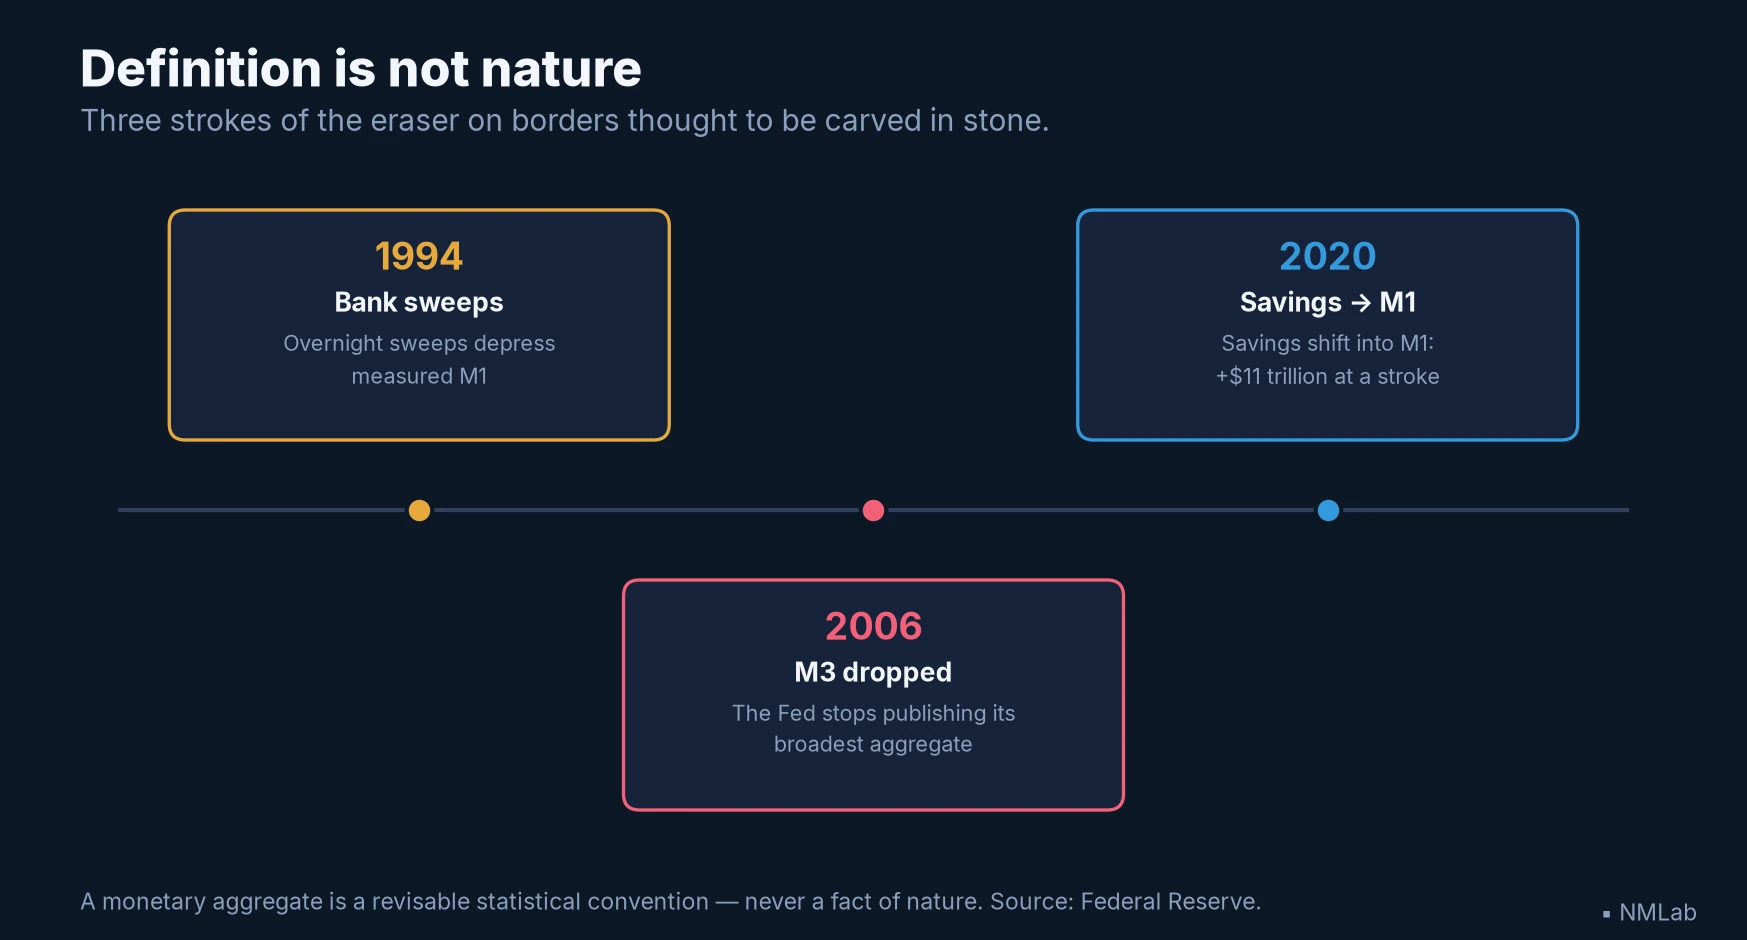
Three eraser strokes on borders thought "carved": the measurement of money is a revisable convention, not a constant.
Why a passbook, and not a share
There remains the fundamental question, the one every clear-eyed beginner asks: where does money stop? Why does a savings passbook enter the aggregates, and not the share, the long bond or the gold bar — which are often worth far more?
The split turns on two requirements that money, alone, satisfies together. The first is to be a means of payment, or to become one in a single move and with no delay: the demand deposit pays directly, the passbook turns into one by a simple transfer. The second, subtler, is the fixity of nominal value: one euro of deposit is worth one euro tomorrow, whatever happens to markets. It is this second test that exiles the share and the long bond from money — not because they are illiquid (a blue-chip stock sells in a second), but because their value is never guaranteed: you don't know how much you'll get. An asset whose price dances cannot serve as a stable unit of account or a safe short-term store of value; it is an investment, not money. The gold bar fails both tests at once. That is why M3 itself stops at debt securities of under two years and leaves out shares and long-term debt: beyond that, price risk disqualifies the asset as money.
There is the dividing line — and it explains the whole architecture. You stack assets by decreasing moneyness; you include as long as the double requirement roughly holds; you stop when price risk takes over. The International Monetary Fund indeed calls the difference M2 − M1 quasi-money: assets liquid enough to count, not liquid enough to pay with. Between the banknote and the share runs a whole spectrum, and each aggregate is only a decision — defensible, revisable — about where to draw the line.
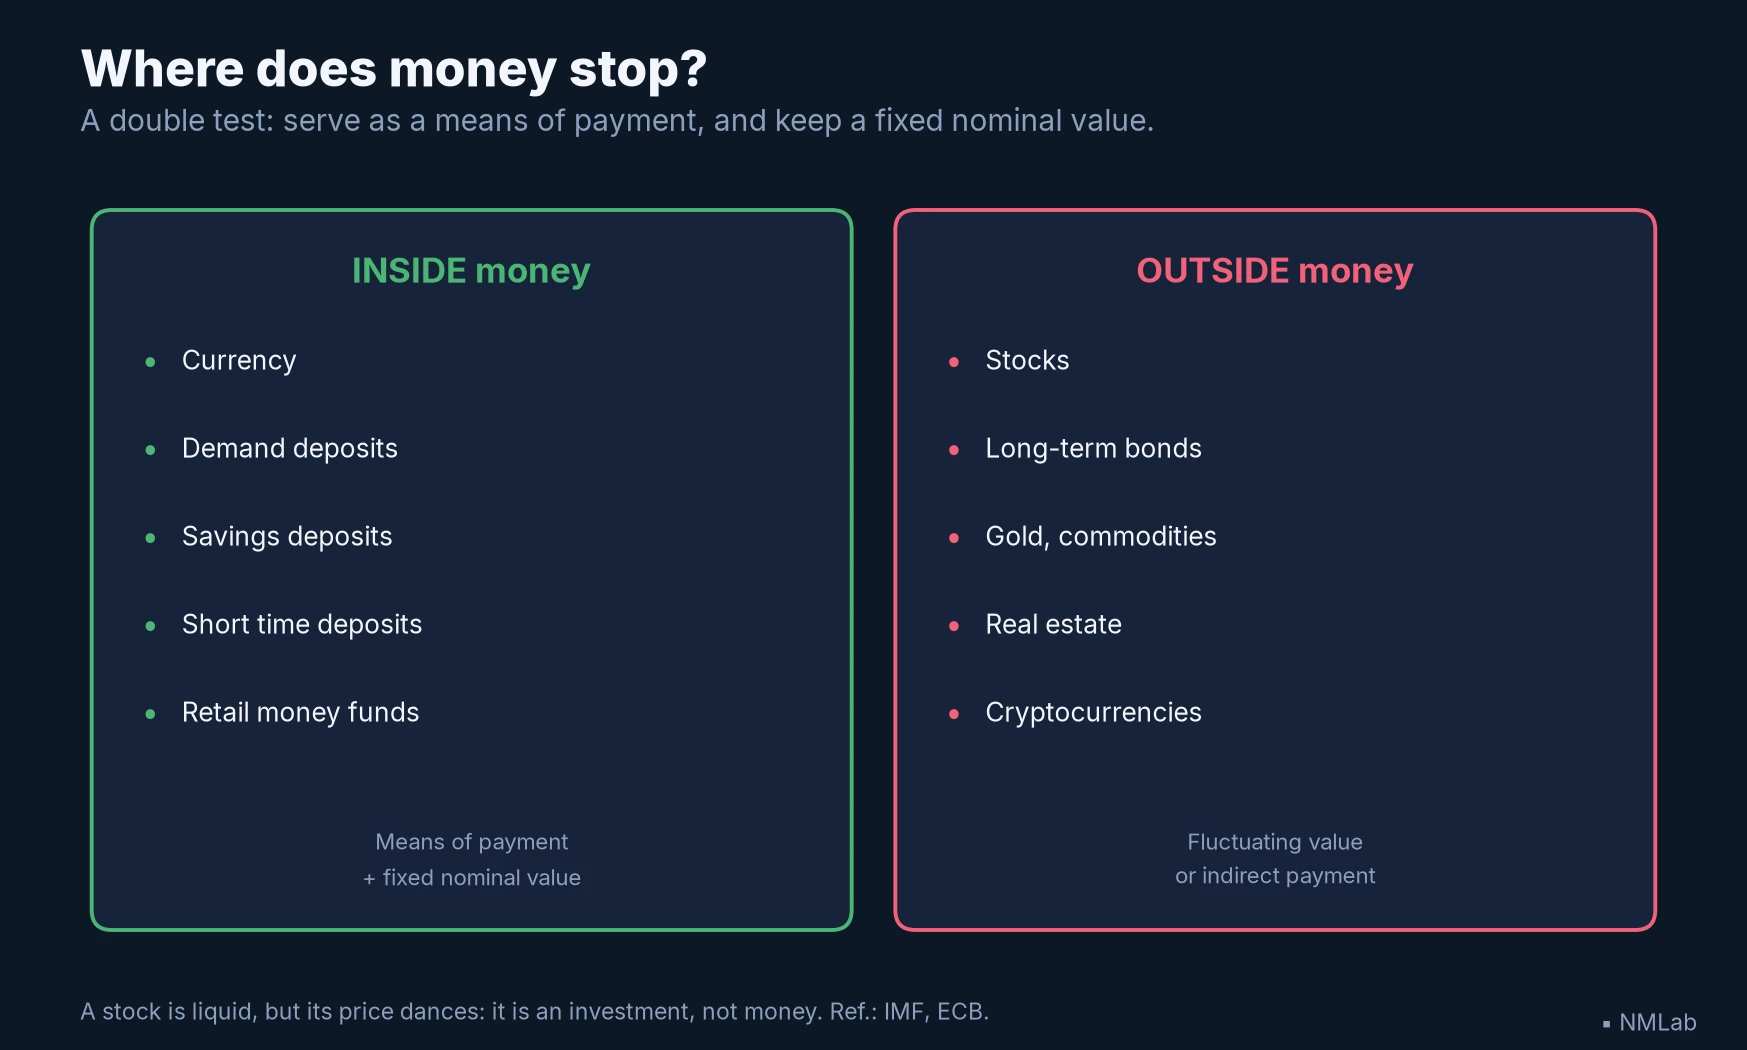
The double test: means of payment and fixed nominal value. A stock is liquid but its price dances — an investment, not money.
From target to indicator
Since these aggregates measure "money," wouldn't it be enough to steer their growth to master the economy? The temptation was real, the failure resounding: the central banks that aimed at money-supply targets in the 1970s and 1980s all abandoned them, caught out by Goodhart's law from chapter 6 — no sooner did the Fed or the Bundesbank set an M1 or M3 objective than financial innovation, new accounts and sweeps first among them, blurred the very measure that had become a target. The next chapter will try that case in full.
Should we then throw the aggregates out? That would be the opposite excess: chapter 24 showed that they speak up again at the extremes, when inflation awakens. The aggregate is no longer a target; it remains a thermometer, valuable at those moments. Economists even work to build better ones: the Divisia aggregates, formalized by William Barnett in 1980, weight each component by its actual liquidity rather than adding everything up at par — a passbook is not worth as much, monetarily, as a banknote. The Center for Financial Stability publishes an American version each month — a sign that the question "what exactly are we adding up?" is no accounting detail: it is the heart of the matter.
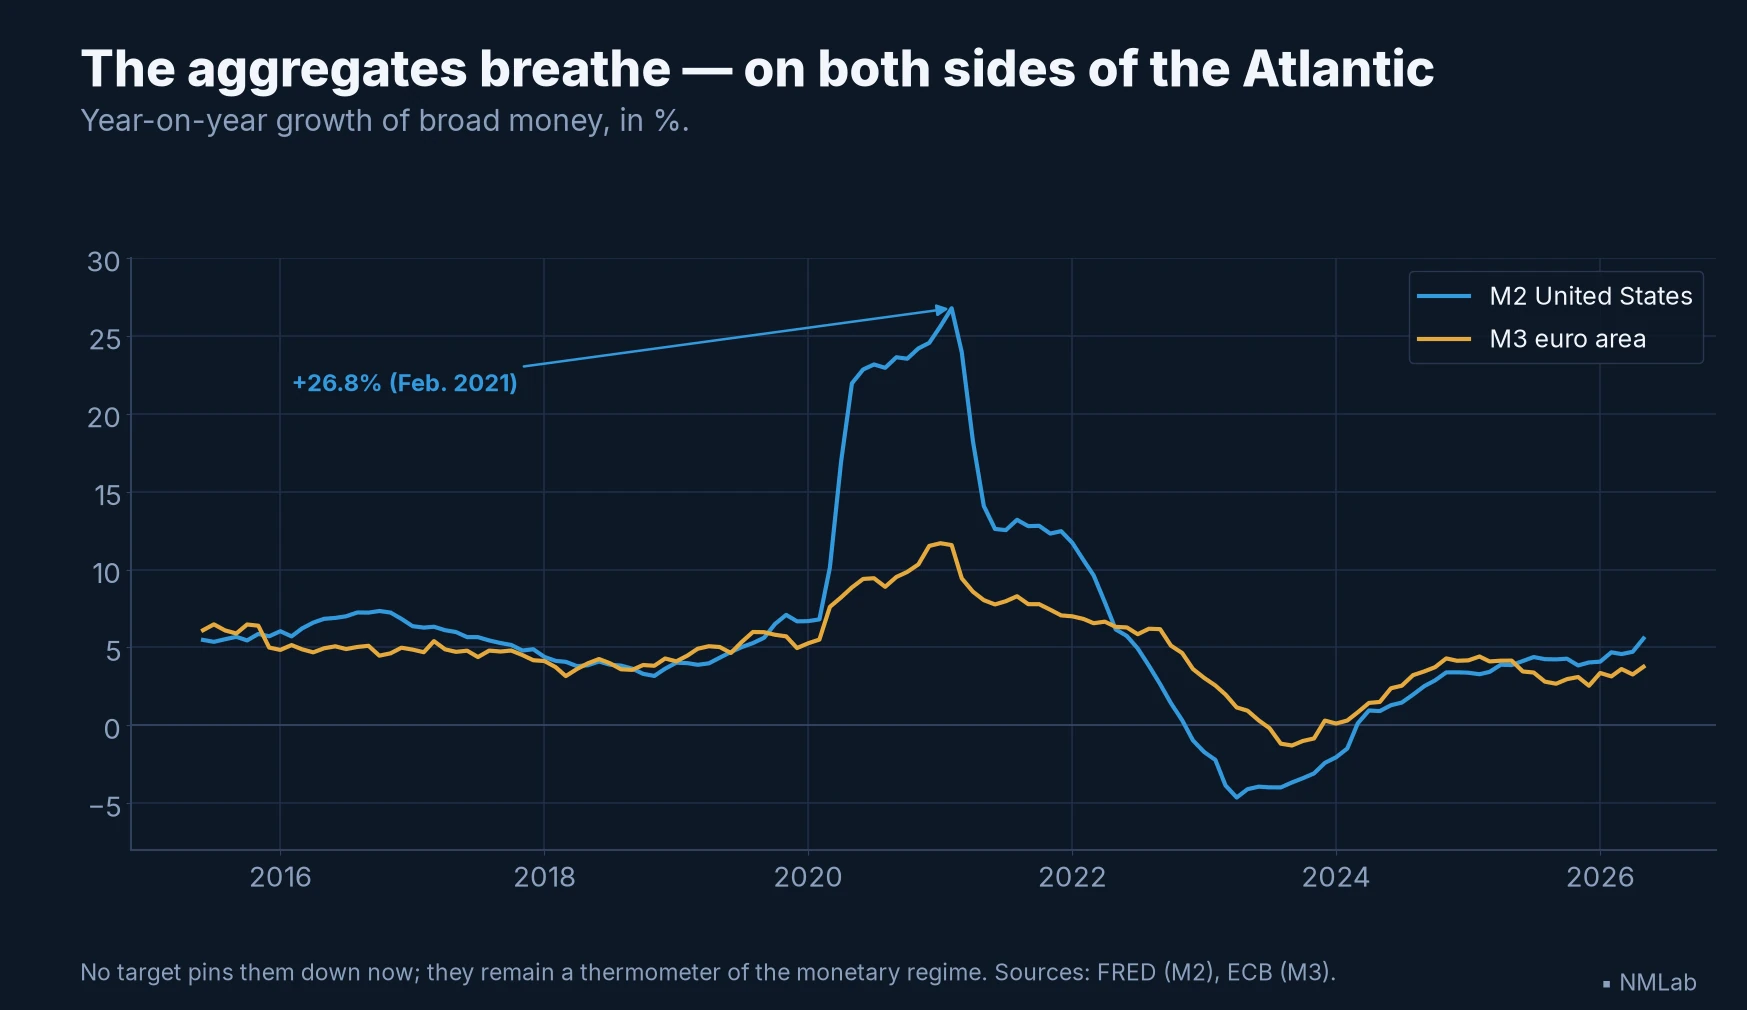
No longer a target but a thermometer: on both sides of the Atlantic, the aggregate breathes to the rhythm of the great episodes.
What it changes for your investments
Three reflexes, to close, are worth more than a theory.
The first: never mistake a jump in definition for a real flow. The viral chart of 2021 is the textbook case — an imaginary printing press born of a reclassification of passbooks. Before you take fright at an aggregate that soars or collapses, check that a border has not simply moved. The second: read the aggregate by its components and its source, never as a bare number. Chapter 23 established it with the counterparts of M3 — the same rise can come from a credit boom, a monetized deficit or a mere return of savings into deposits, and those stories have neither the same causes nor the same sequels. To know that American M1 now contains passbooks, that European M3 takes in repos, is to know what you are looking at.
The third, the most important: the aggregate describes a regime; it does not give a buy signal. It will not tell you to buy a given stock on Tuesday. But followed intelligently — in level, in growth, by its counterparts, through its breaks of definition — it locates the monetary backdrop against which your investments evolve: broad or narrow expansion, contraction, credit freeze. And that backdrop, the next chapter will at last tie to prices. For we now know how to measure money; there remains the question that has haunted economics since Bodin and Copernicus: when its quantity rises, where does the money go — into prices, into output, or nowhere?
Key takeaway
- A gradient, not a box — Money is ranked by liquidity (moneyness): from currency (most liquid) to short savings. The public's aggregates are Russian dolls — M1 ⊂ M2 ⊂ M3 — each adding a less "cash-like" layer (quasi-money, i.e. M2 − M1). The base (banknotes + reserves), central-bank money, is a separate measure: it shares only banknotes with M1.
- What each letter contains — Base: banknotes + reserves (central-bank money). M1: currency + demand deposits + other liquid deposits. M2 (United States): + time deposits under $100,000 + retail money funds. Currency? A tenth of M2, no more.
- The letter is not the thing, and it moves — Since 2020, American passbooks are in M1; in the euro area, in M2: comparing the two continents' M1 is misleading (prefer M2/M3). And those borders get redrawn — sweeps in 1994, M3 dropped in 2006, reclassification in 2020: a break in definition is not a movement of the economy.
- Where money stops — Double test: means of payment and fixed nominal value. A stock is liquid but its price dances — an investment, not money.
- Dead target, living thermometer — Money targets sank (Goodhart's law); the aggregate stays useful at the extremes (money-inflation link regime-conditional, BIS 2023). Divisia refines the counting.
- For your investments — Don't mistake a jump in definition for a real flow; read the aggregate by its components and source; it describes a regime, it gives no buy signal.
The rest of the journey
We finally know what "the money supply" covers: not a single object, but a stack of assets ranked by liquidity, and lines drawn by convention where price risk begins to bite. There remains the question these measures at last make askable: what is the point of counting money? For four centuries a stubborn intuition has held that its quantity governs prices — "too much money chasing too few goods." Is it true? Always? The most famous and most misleading equation in economics, MV = PQ, claims to link money, prices and activity in a single stroke. Next chapter: "The Quantity Theory of Money (MV = PQ): Linking Money, Prices and Activity." One check in the meantime: open the M1 series on the Fed's site, find the May 2020 step, and recall what it hides — a money-supply chart is never read without its instruction manual.
Sources and further reading
- Federal Reserve, statistical release H.6, Money Stock Measures — the current definitions of M1 and M2, May 2026 values; and the H.6 Technical Q&As on the 2020 overhaul.
- Federal Reserve, release H.3 and Technical Q&As — the monetary base (currency in circulation + reserves), distinct from M1's "currency."
- Federal Reserve, Interim final rule amending Regulation D, 24 April 2020 (Federal Register, 28 April 2020) — removal of the six-transfer limit on savings accounts, following the cut of reserve requirements to zero (effective 26 March 2020).
- Federal Reserve, Discontinuance of M3, announced 10 November 2005, effective 23 March 2006 — M3 "conveys no information beyond M2."
- Richard G. Anderson & Robert H. Rasche, "Retail Sweep Programs and Bank Reserves, 1994-1999," Federal Reserve Bank of St. Louis, Working Paper 2000-023 — the sweeps that depressed measured M1.
- European Central Bank, Monetary aggregates (definitions of M1, M2, M3) and Monthly Bulletin, February 1999, "Euro area monetary aggregates and their role in the monetary policy strategy" — the degree of moneyness.
- European Central Bank, Monetary developments in the euro area, May 2026 — outstanding amounts and growth of M1, M2, M3.
- International Monetary Fund, Monetary and Financial Statistics Manual, ch. 6 — the notion of quasi-money (near money).
- William A. Barnett, "Economic Monetary Aggregates: An Application of Index Number and Aggregation Theory," Journal of Econometrics, 1980; Center for Financial Stability, Divisia Monetary Data (AMFM) — liquidity-weighted aggregates.
- Milton Friedman & Anna J. Schwartz, Monetary Statistics of the United States: Estimates, Sources, Methods, NBER / Columbia University Press, 1970 — the founding treatise on what is being added up, and why the choice of aggregate is never neutral.
- Michael T. Belongia & Peter N. Ireland, "The Barnett critique after three decades: A New Keynesian analysis", Journal of Econometrics 183(1), 2014 — what changes when you move to liquidity-weighted aggregates.
- Claudio Borio, Boris Hofmann & Egon Zakrajšek, "Does money growth help explain the recent inflation surge?", BIS Bulletin no. 67, 26 January 2023 — the regime-conditional money-inflation link.
- Figure data: FRED (M1SL, M2SL, CURRSL, DEMDEPSL, STDSL, RMFSL, BOGMBASE, TOTRESNS) and ECB (BSI statistics) — vintage of 24 July 2026.