12. Productivity and Long-Run Growth: The Variable That Decides Everything
· Updated on · 18 min read
"Productivity isn't everything, but in the long run it is almost everything. A country's ability to improve its standard of living over time depends almost entirely on its ability to raise its output per worker." The line is Paul Krugman's, opening the first chapter of The Age of Diminished Expectations in 1990. Two "almost"s in two sentences: that is rare for an economist, and it is deliberate. Krugman is not saying productivity explains everything — crises, unemployment, inflation have their own springs. He is saying that over the horizon that matters to a saver, the ten, twenty, thirty-year horizon, almost nothing else counts.
This is the chapter where the series changes its scale of time. Until now we have watched the economy quarter by quarter: GDP speeding up or slowing down, the cycle, the output gap. Productivity could not care less about the quarter. It advances in waves of decades, it almost never makes the headlines, and yet it is what decides whether your children will live twice as well as you or barely better. For an investor, understanding productivity means understanding where the long-run return on equities comes from, at its root — the thread we pulled on in chapter 11.
At a glance — Level: Intermediate · Prerequisites: chapter 10
By the end of this chapter, you will be able to:
- tell apart the two engines of productivity — the capital you stack, the ideas that never wear out;
- explain why a general-purpose technology takes a generation to pay off (the lesson of the dynamo);
- see why half a point of productivity changes a life, and who actually reaps the gains.
What "productivity" means, and why it is magic
Let's clear up a misunderstanding first. "Being productive," in everyday speech, evokes someone who works hard, long hours. In macroeconomics it is nearly the opposite. Labor productivity is output per hour worked: what one hour of work manages to make. It rises not when you work more, but when a given hour produces more — thanks to better machines, better organization, better knowledge. Productivity is the art of reaping more while sowing the same. And on this ground, the last half-century is a marvel: in the United States, output per hour worked was multiplied by 5.2 between 1947 and 2025. Put another way, what a worker took an hour to produce in 1947, he produces today in eleven and a half minutes. All the rest of the time — the other forty-eight minutes — is net gain: more goods, more services, more free time. That is where, and nowhere else, the enrichment of modern societies hides.
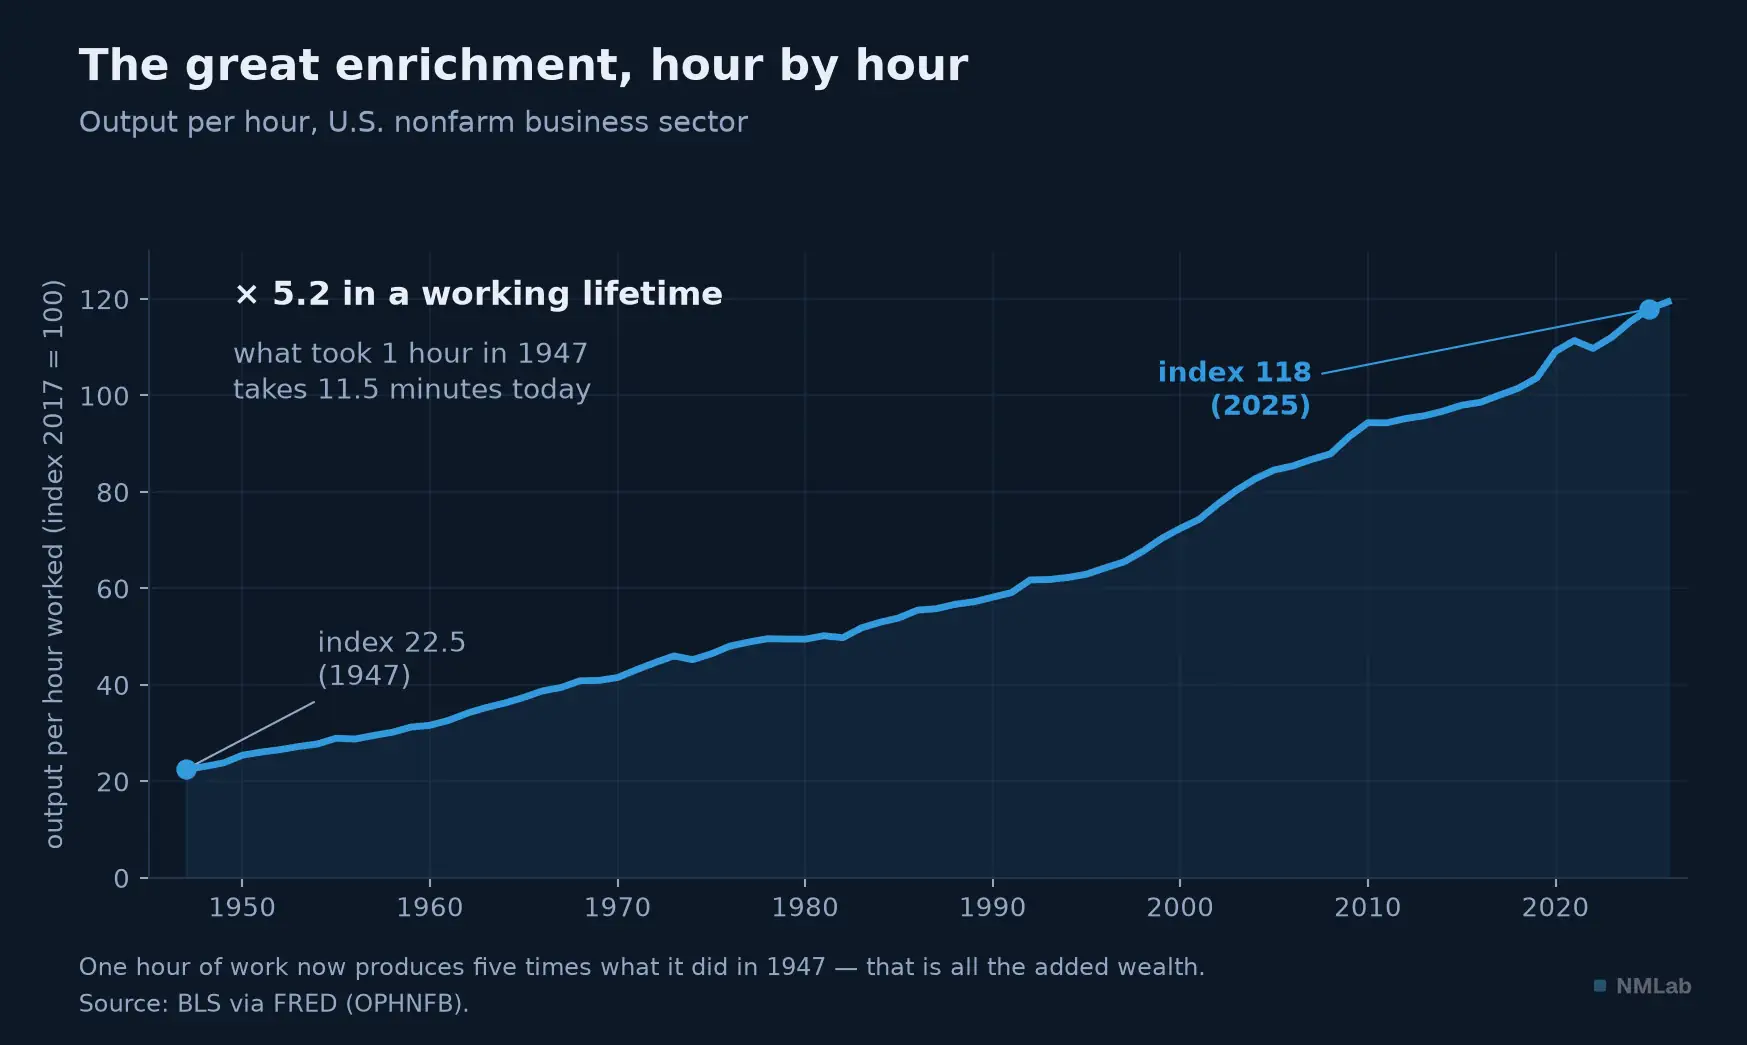
A curve that rises without almost ever falling back: this is the wealth produced by one hour of work. The entire modern standard of living is in that slope.

This figure has flesh. Multiplying hourly output by five is not just five times more goods: it is generalized domestic comfort, modern medicine, paid holidays, extended schooling, retirement — everything a society can afford only if each hour of work yields more. And the miracle is double, because over the same period working hours fell: our grandparents produced less per hour and worked more hours. The real gain in living standards is therefore even greater than the curve alone shows. That is the deep reason why an economist, asked to keep just one number to judge a country's long-run health, would choose this one.
That leaves two engines under the hood to distinguish. An hour can produce more for two reasons. Either the worker has more capital — more machines, computers, factories: this is "capital deepening." Or you draw more of everything, capital and labor together, thanks to pure progress, ingenuity, organization: this is total factor productivity, TFP. TFP is the magic part, the "residual" Robert Solow isolated in 1957: what growth produces without your having added either hands or machines. It is, at bottom, the measure of an economy's collective intelligence. Hold on to the distinction: you can grow productivity for a while by piling up capital, but only TFP grows an economy durably, without limit. An example makes the difference clear. Give a ditch-digger a bigger shovel, then a mechanical excavator: his output per hour explodes — but that is capital deepening, and each extra machine ends up yielding a little less than the last. Conversely, when someone invents the very principle of hydraulics that makes the excavator possible, that knowledge serves everyone, forever, without wearing out: that is TFP. Capital has diminishing returns; ideas do not. That is why countries end up distinguished not by the quantity of their machines, but by the vitality of their TFP.
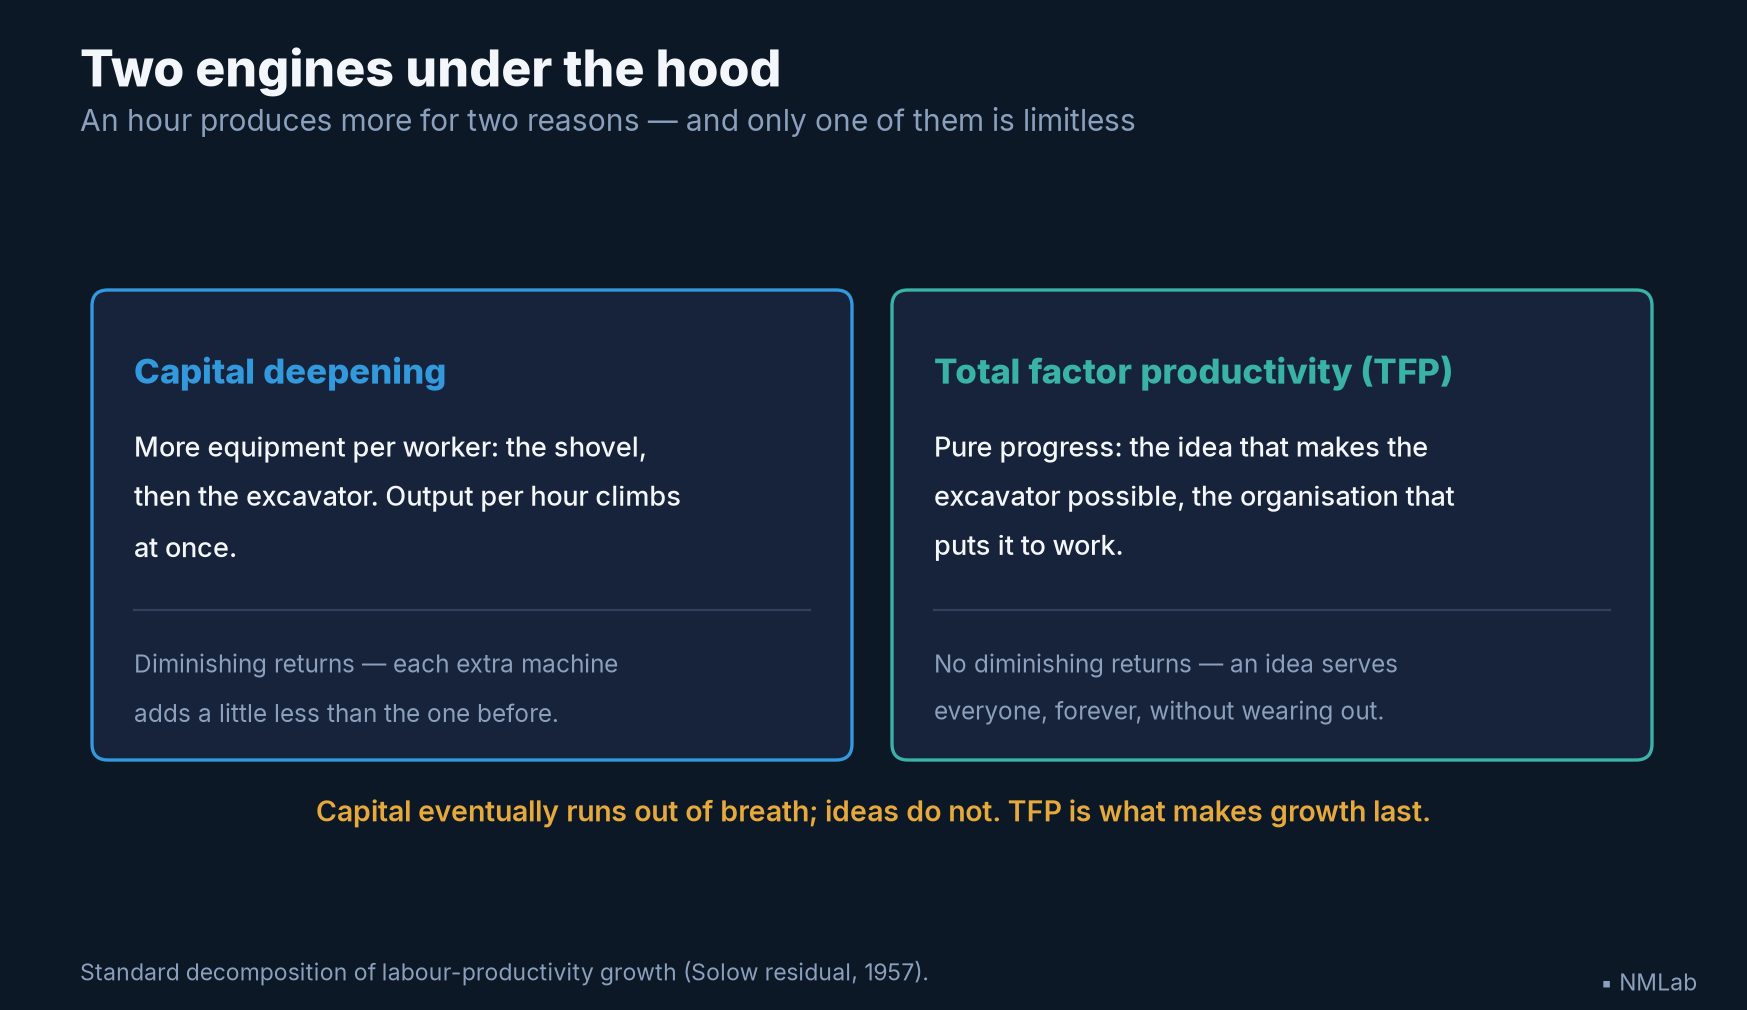
Capital eventually runs out of breath; ideas do not — hence the special place TFP holds in everything that follows.
The waves — and the black hole of the 1970s
The great productivity curve, seen from afar, is a steady slope. Up close, it advances in fits, in waves, and those waves tell a dramatic story.
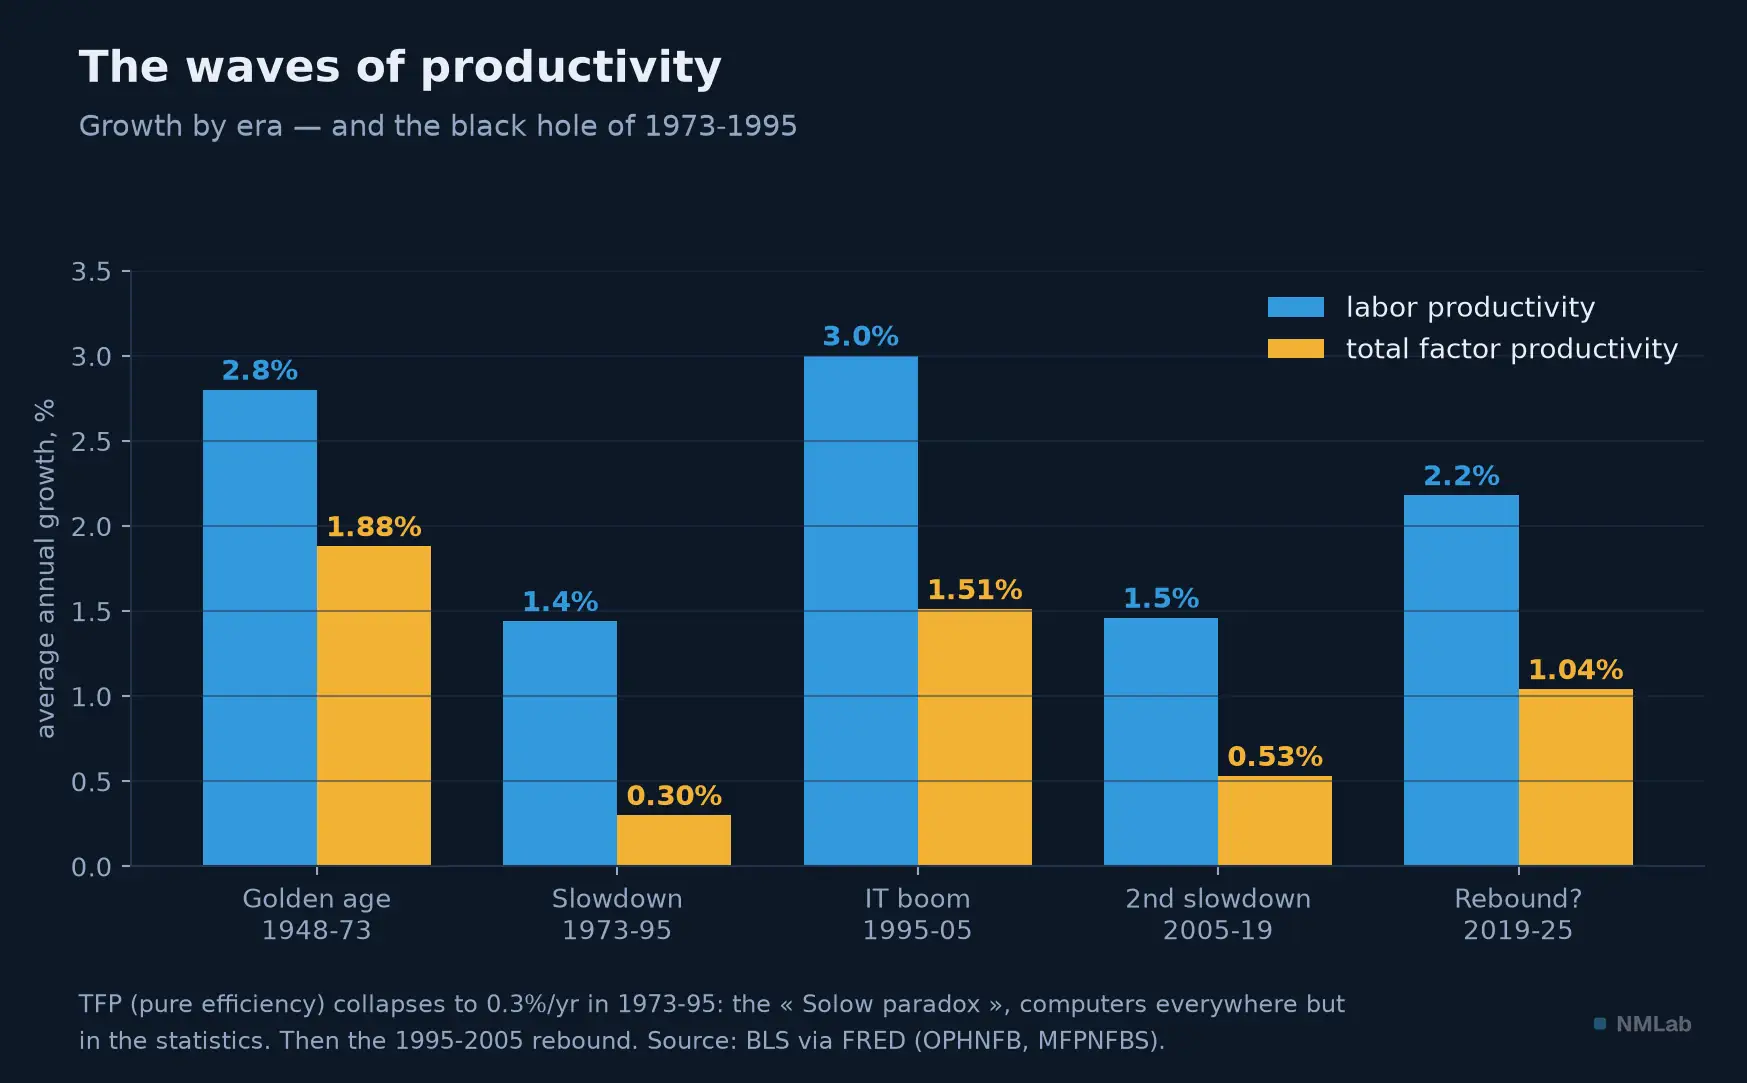
Labor productivity (blue) and TFP (amber) by era. The "black hole" of 1973-1995 leaps out: TFP there falls to 0.30% a year.
The postwar years were a golden age: from 1948 to 1973, American hourly productivity grows by 2.8% a year, carried by TFP of 1.88%. At that pace, living standards double every twenty-five years. Then, around 1973, something breaks: from 1973 to 1995, productivity falls to 1.44% a year, and TFP, the magic part, collapses to 0.30% — practically zero. For an entire generation, collective ingenuity seems to stall. Economists have a name for this mystery, the productivity slowdown, and it remains, to this day, one of the great unsolved puzzles of the discipline. Suspects are not lacking: the two oil shocks of 1973 and 1979, the exhaustion of postwar catch-up, the massive arrival of less-experienced workers, a slowdown in "deep" innovation. None has an alibi; none, on its own, is big enough for the crime — a breakdown so long and so general, striking every rich country at once. It is that global simultaneity that baffles: when an ailment strikes everywhere at the same time, it stems from something deeper than any one country's circumstances.
What makes this black hole dizzying is the backdrop. The 1970s and 1980s are the dawn of computing: the microprocessor, the personal computer, the first networks. A technological revolution under way — and productivity stagnant. It is the paradox Solow himself formulated, in a 1987 review for the New York Times Book Review, in a line that became legendary: "You can see the computer age everywhere but in the productivity statistics." Computers were visible on every desk; they were invisible in the numbers. How is that possible?
The lesson of the dynamo
The deepest answer came from an economic historian, Paul David, in a 1990 article with a limpid title: The Dynamo and the Computer. David recalls a troubling precedent. At the end of the nineteenth century, another miraculous technology had arrived: electricity. Edison's first power station opens in New York in 1882, and yet, in 1899, electric lighting was in only 3% of homes, and electric motors made up less than 5% of factory mechanical drive. It took until the early 1920s — nearly four decades after the first power station — for just half of factory drive to be electrified. And only then did productivity take off.
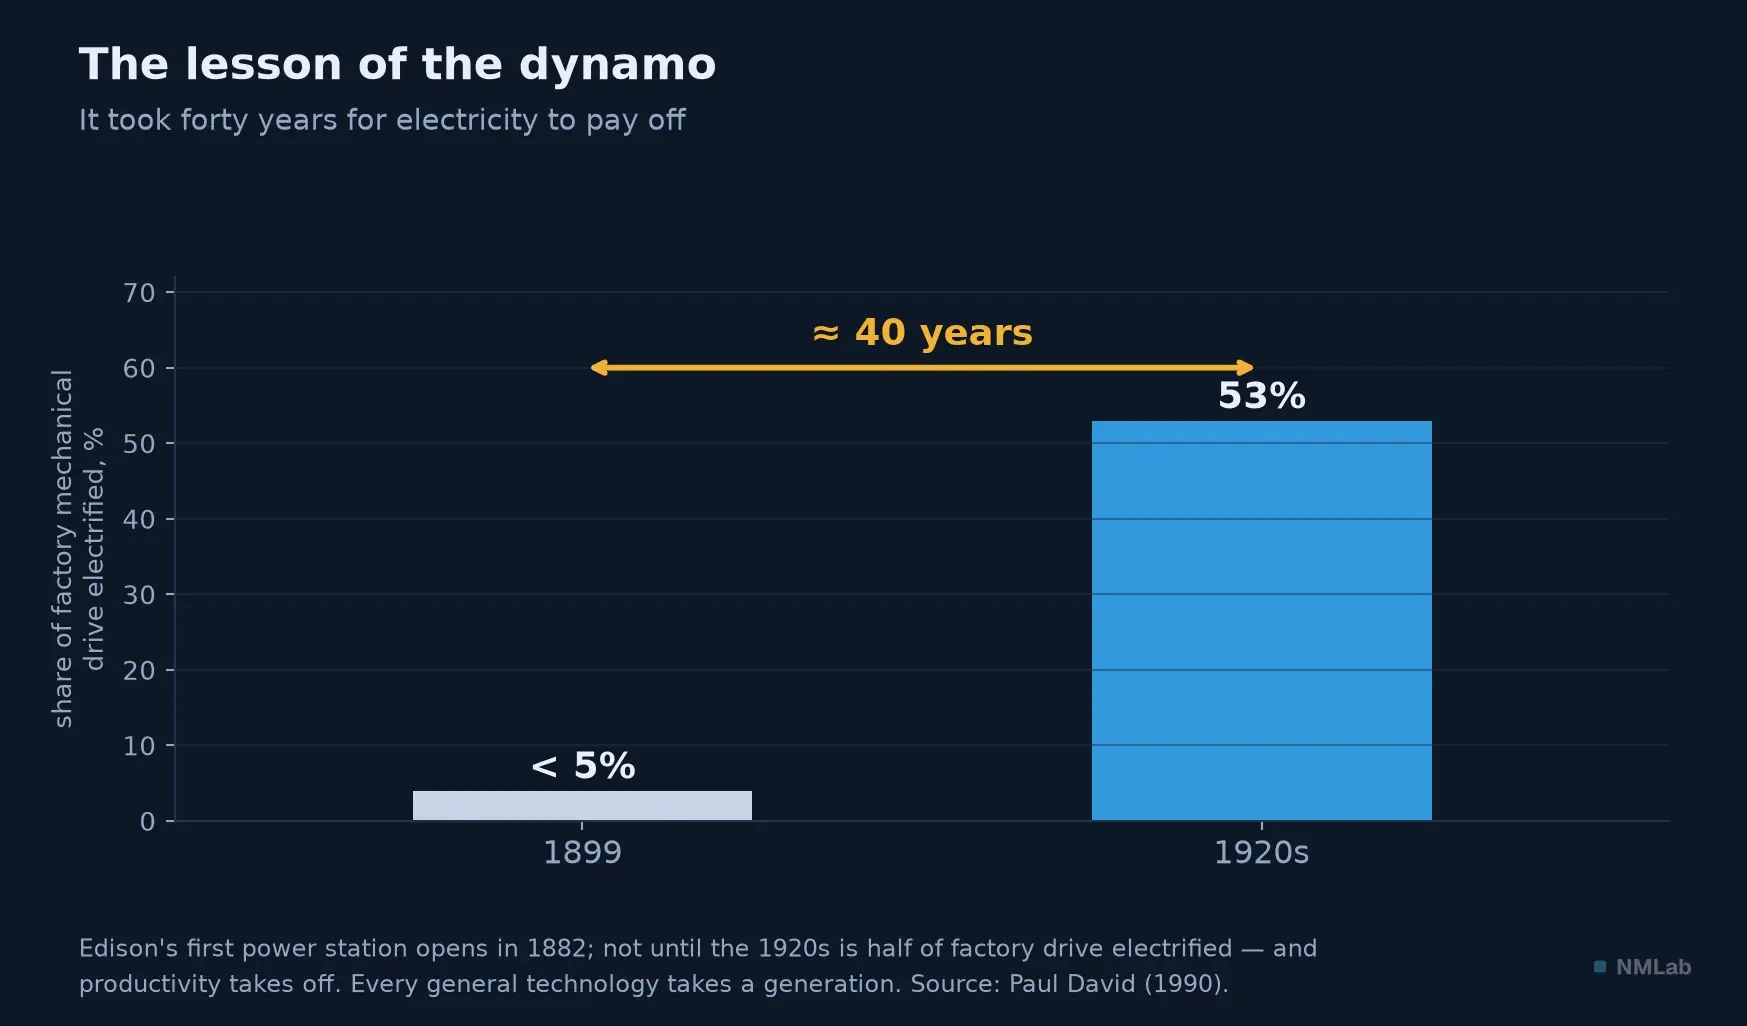
Inventing the machine is not enough: you have to rebuild the factory around it. That generation-long lag is the key to the whole chapter.
Why so slow? Because a general-purpose technology is not enough: you have to reinvent around it. At first, factories had simply replaced their big central steam engine with a single large electric motor, driving the same tangle of shafts and belts. No gain. The real leap came when people understood they could put a small motor on each machine — the "unit drive." Then, and only then, could you abandon the transmission shaft, build single-story factories, reorganize production flows, light and ventilate differently. It was no longer a matter of plugging in a machine: you had to rethink the whole factory. That takes a generation.
David's lesson holds for the computer of the 1980s as, today, for artificial intelligence: the productivity gain of a general technology arrives not when the technology appears, but when organizations have remade themselves around it. That is exactly what happened next. From 1995 to 2005, American productivity jumps to 3.0% a year, TFP to 1.51%: the Solow paradox finally dissolves, computing starts to pay off, a generation after its arrival. Keep this story in mind: it is the finest lens there is for the debate on AI, the subject of the next chapter. For the upturn was brief. As early as 2005, the same again: productivity falls back to 1.46% a year over 2005-2019, TFP to 0.53%. A second slowdown, in the full flush of smartphones and the Internet. Since 2019, a flicker — 2.18% a year — of which no one yet knows whether it is a true recovery or a pandemic flash in the pan. That is why productivity is the great suspense of the contemporary economy.
And Europe? This course already holds the elements, and they point the same way — only worse. Euro-area trend growth fell from 2.7% to 1.0% between 1990 and 2022, and the zone produced only 1.23% annual growth over 2000-2025, 0.94% per head (chapter 11). Yet its working-age population no longer grows, and is set to shrink (chapter 14): and by that identity — growth = working-age population + productivity — what remains of that growth is, essentially, productivity. The slowdown described here is therefore no American singularity. We measure it on American figures because the long, homogeneous series of the Fed and the BLS are the yardstick for the entire literature: the instrument is American; the ailment is not. Europe lives it with one extra handicap: chapter 16 will show that, at an equal investment rate, it puts far less than America into the intangible — patents, software, research — that is, into precisely what builds tomorrow's TFP.
Why it slows: three culprits
Three explanations, not mutually exclusive, dominate the debate — and all three should interest an investor. The first is unsettling: ideas are getting harder to find. That is the title, and the result, of a landmark article by Nicholas Bloom, Charles Jones, John Van Reenen and Michael Webb (2020). Their most striking example is Moore's Law, that regular doubling of chip density: to sustain it today takes more than eighteen times as many researchers as in the early 1970s. Across the whole American economy, research productivity declines by about 5.3% a year — it halves every thirteen years. You have to double the research effort every thirteen years, the authors say, just to keep growth constant. Beware the misreading: this does not mean we find fewer ideas — we find just as many, but at the cost of ever-larger armies of researchers. The well is not dry; it is simply deeper.
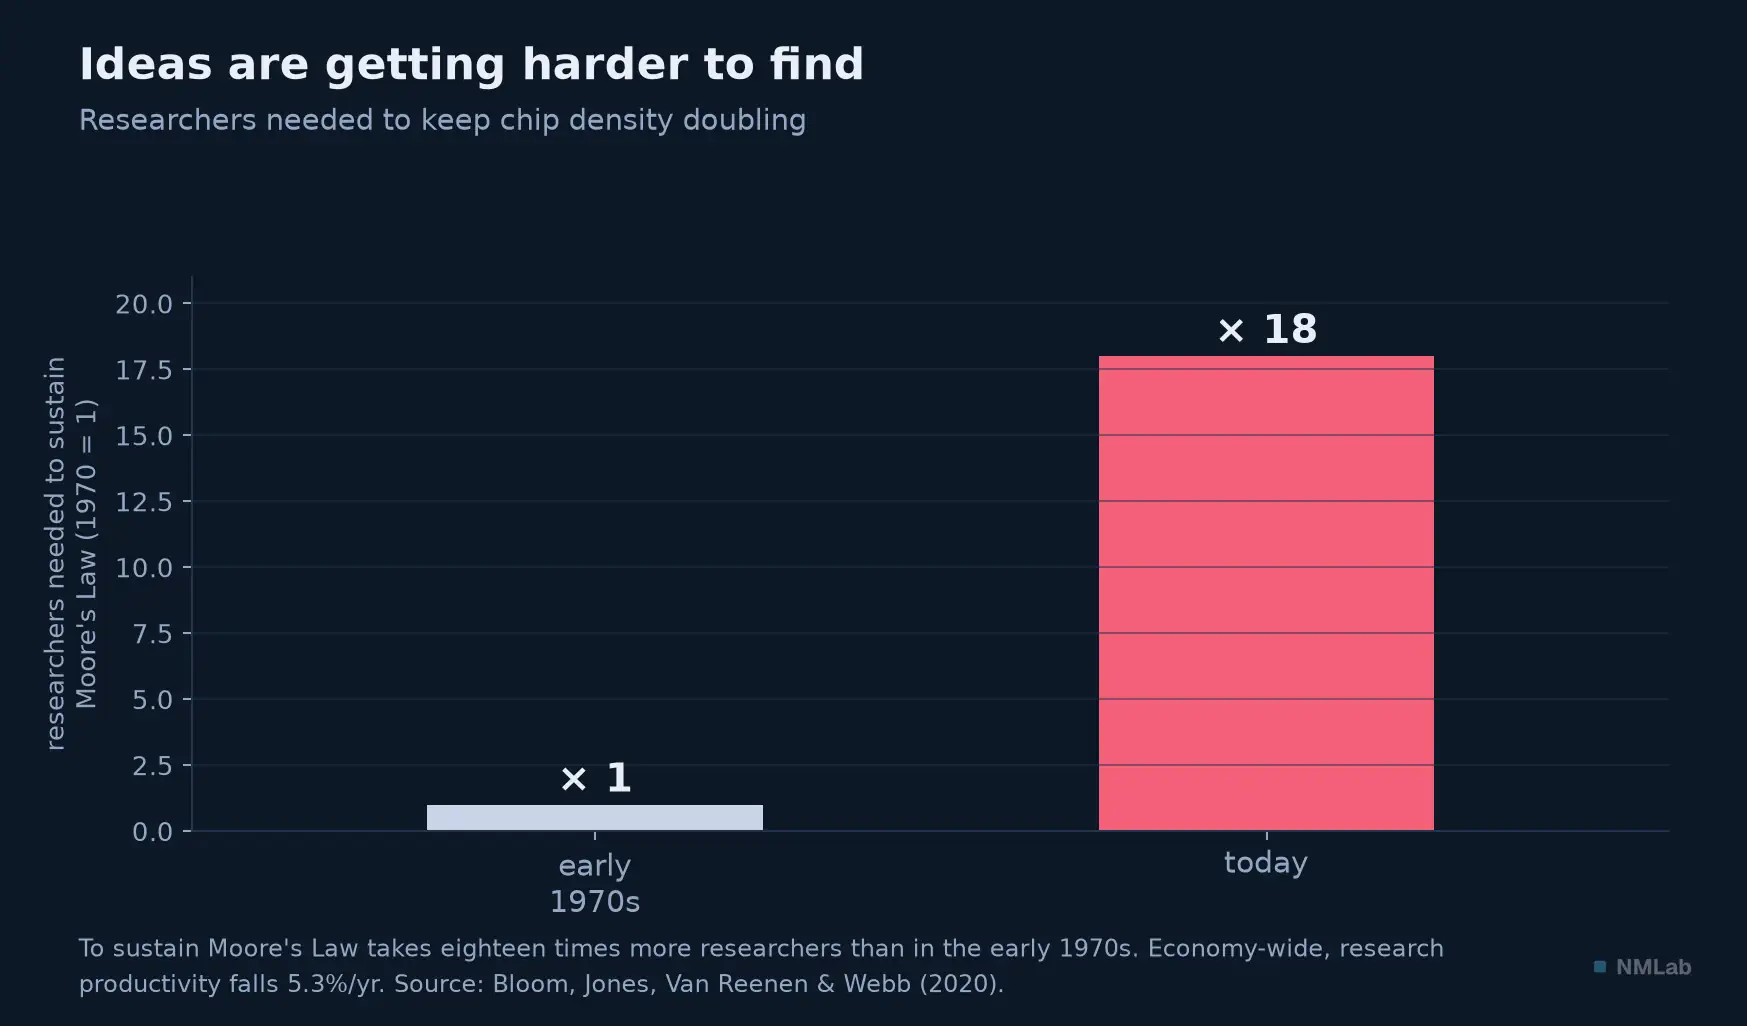
The same quantity of progress costs ever-larger armies of researchers: ideas grow scarcer the further we advance.
The second explanation is older and more elegant. In 1966, William Baumol and William Bowen named it the cost disease. Their image has stuck: playing a Schubert quartet of forty-five minutes requires today exactly what it required in Schubert's day — four musicians, about three man-hours. No technical progress has ever cut that figure, or ever will. Productivity, in that quartet, is frozen forever. Now if industry sees its costs melt while music, teaching and care keep theirs, then, mechanically, those services become relatively more and more expensive. That is why, as an economy grows richer and shifts to services, its overall productivity growth slows: the share of "incompressible" activities within it swells. Baumol added, in a late book (2012), a note of optimism that is always forgotten in the quoting: this rise in costs is sustainable, because general wealth is rising; we can afford more health and education, provided we accept devoting a growing share of our income to them.
The cost disease is not a concert-hall curiosity: it is the clearest explanation of a fact that exasperates every household. Why, for forty years, have televisions and computers collapsed in price while university, childcare and hospital care have soared? Because the former are the realm of galloping productivity, and the latter that of the Schubert quartet: activities where producing requires, incompressibly, human time. A teacher cannot teach twice as fast; a nurse cannot care in half the time without caring less well. The consequence is political as much as economic: as an economy matures, the share of its income swallowed by these "productivity-frozen" services grows — and with it the sensation, misleading but stubborn, that "everything is going up."
The third explanation is the most unsettling, and chapter 6 prepared you for it: what if the slowdown were partly a measurement artefact? The case is serious. What no one pays for is badly counted: search engines, maps and messaging escape the national accounts almost entirely. Quality adjustments on software and equipment remain notoriously hard. And GDP, as chapter 9 showed, stops at the market boundary. Understate real output and you understate productivity.
But the attempts to size this have run against the intuition. Chad Syverson tested the hypothesis head-on in 2017: if mismeasurement explained the slowdown, it would have to be worth something like $2.7 trillion a year. No available valuation of free digital services comes near that sum: you do not fill a hole that size with maps and search engines. And the hole is in the wrong place: the slowdown hits dozens of countries, including those that consume little digital output, and the IT sector is too small a share of GDP to carry the gap on its own. David Byrne, John Fernald and Marshall Reinsdorf, the same year, conclude in the same direction: mismeasurement is real, but it has not worsened at the time of the slowdown — and part of it even runs the other way.
The verdict is therefore a qualified one, and worth holding as such: the thermometer is imperfect, but its imperfection does not explain the slowdown. This matters for an investor, because it is the most reassuring of the three hypotheses — it would suggest the wealth is there and we are merely miscounting it. The data do not allow that comfort.
Who reaps the gains? (Not who you think)
Here is the point that should give pause to any investor tempted to "bet on innovation." Of the value an innovation creates, how much goes to the one who invented it — and therefore to its shareholders? The answer was quantified by William Nordhaus, a future Nobel laureate, in a 2004 study: analyzing the American economy from 1948 to 2001, he estimates that innovators capture only about 2.2% of the total social value they create (within a range of 1.3 to 3.3%). The remaining 98% escapes to consumers, in the form of lower prices and better products. Innovation is a fountain from which the inventor drinks but a mouthful; the rest slakes everyone. That is wonderful news for society — and a warning for anyone who believes it is enough to hold "the innovative companies" to capture progress. Progress, in its mass, cannot be captured: it dilutes into the general standard of living.
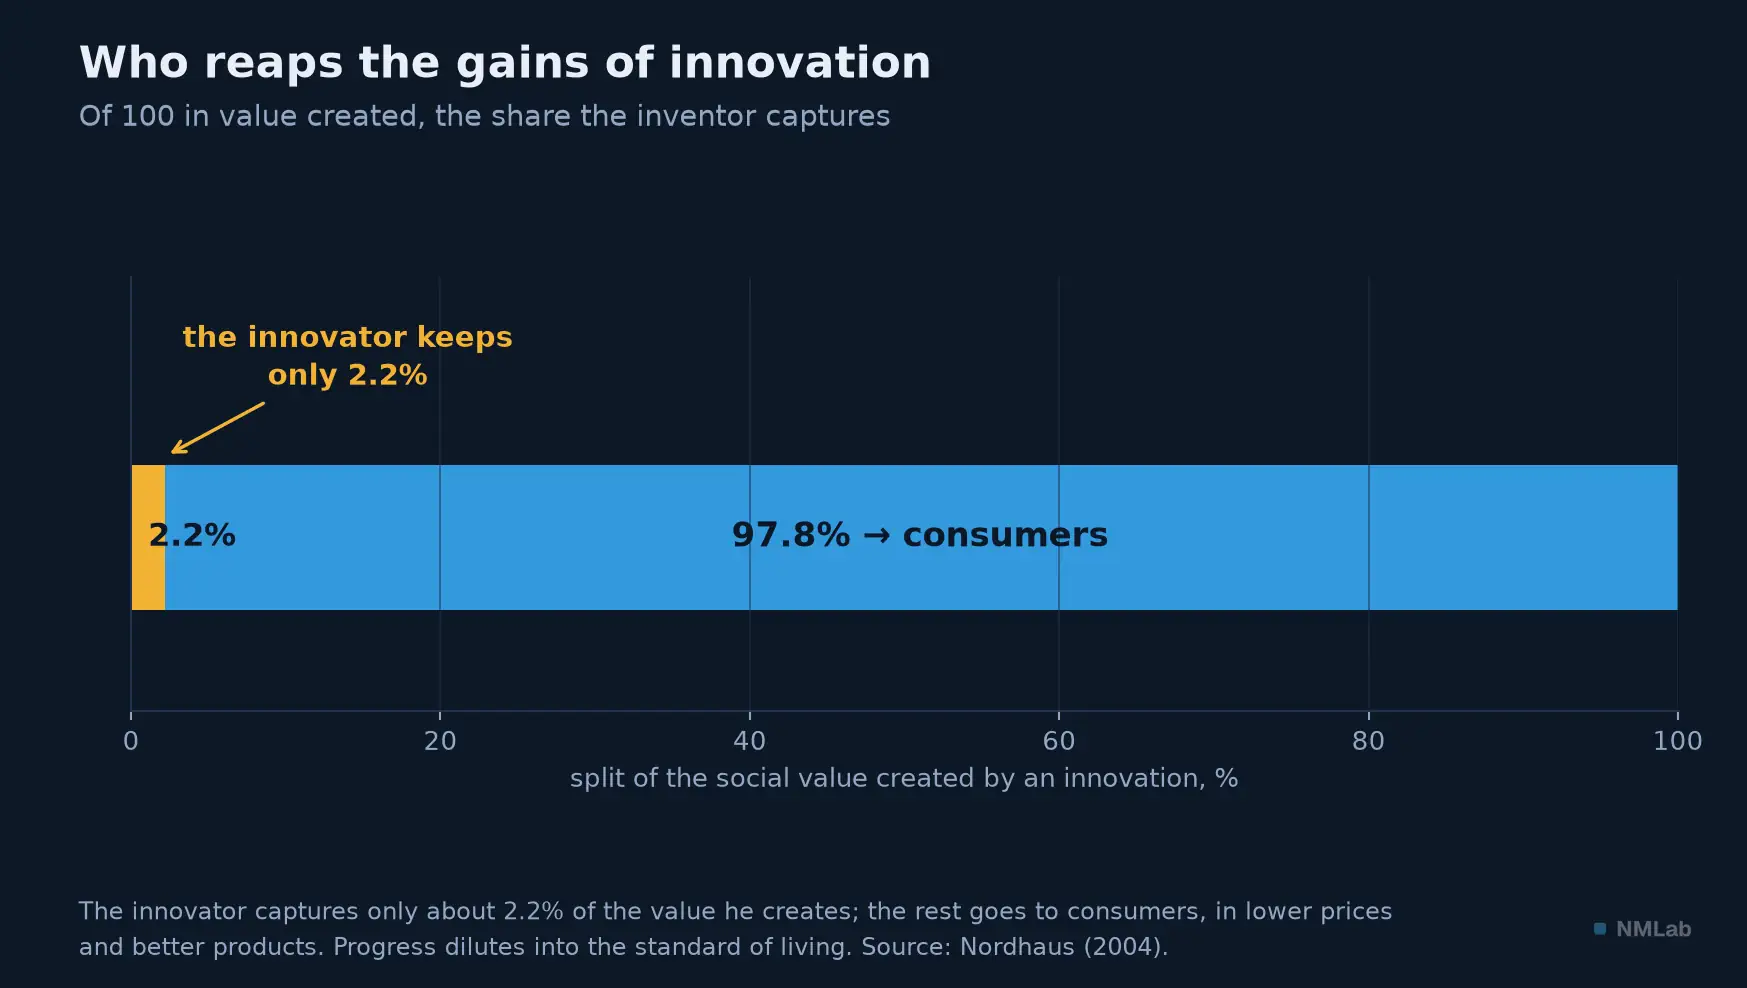
Progress benefits the consumer first, not the holder of capital. That is why productivity lifts the broad index rather than rewarding any one champion.
What to do with all this, concretely, when you invest your money? Three ideas, each flowing from the last. First, productivity is the tide, not the boat: it lifts the whole economy, hence the broad index, more surely than any one champion — Nordhaus's figure is the reminder, the value created escapes to the consumer far more than it accumulates in the inventor. Second, the lesson of the dynamo teaches patience: a real technology can pay nothing for a decade, then change everything, so rushing at the promise often costs dearly while waiting for it pays. Third, and this is the deepest link, the suspense of productivity is the suspense of your returns: if TFP stays numb, trend growth stays low, and with it — remember chapter 11 — the natural rate and the long-run return on assets. Betting on stocks over thirty years means, whether you like it or not, betting on the return of productivity.
The half-point that changes a life
Let's end where we began, with Krugman. Why "almost everything"? Because productivity compounds, and compounding turns small gaps into chasms.
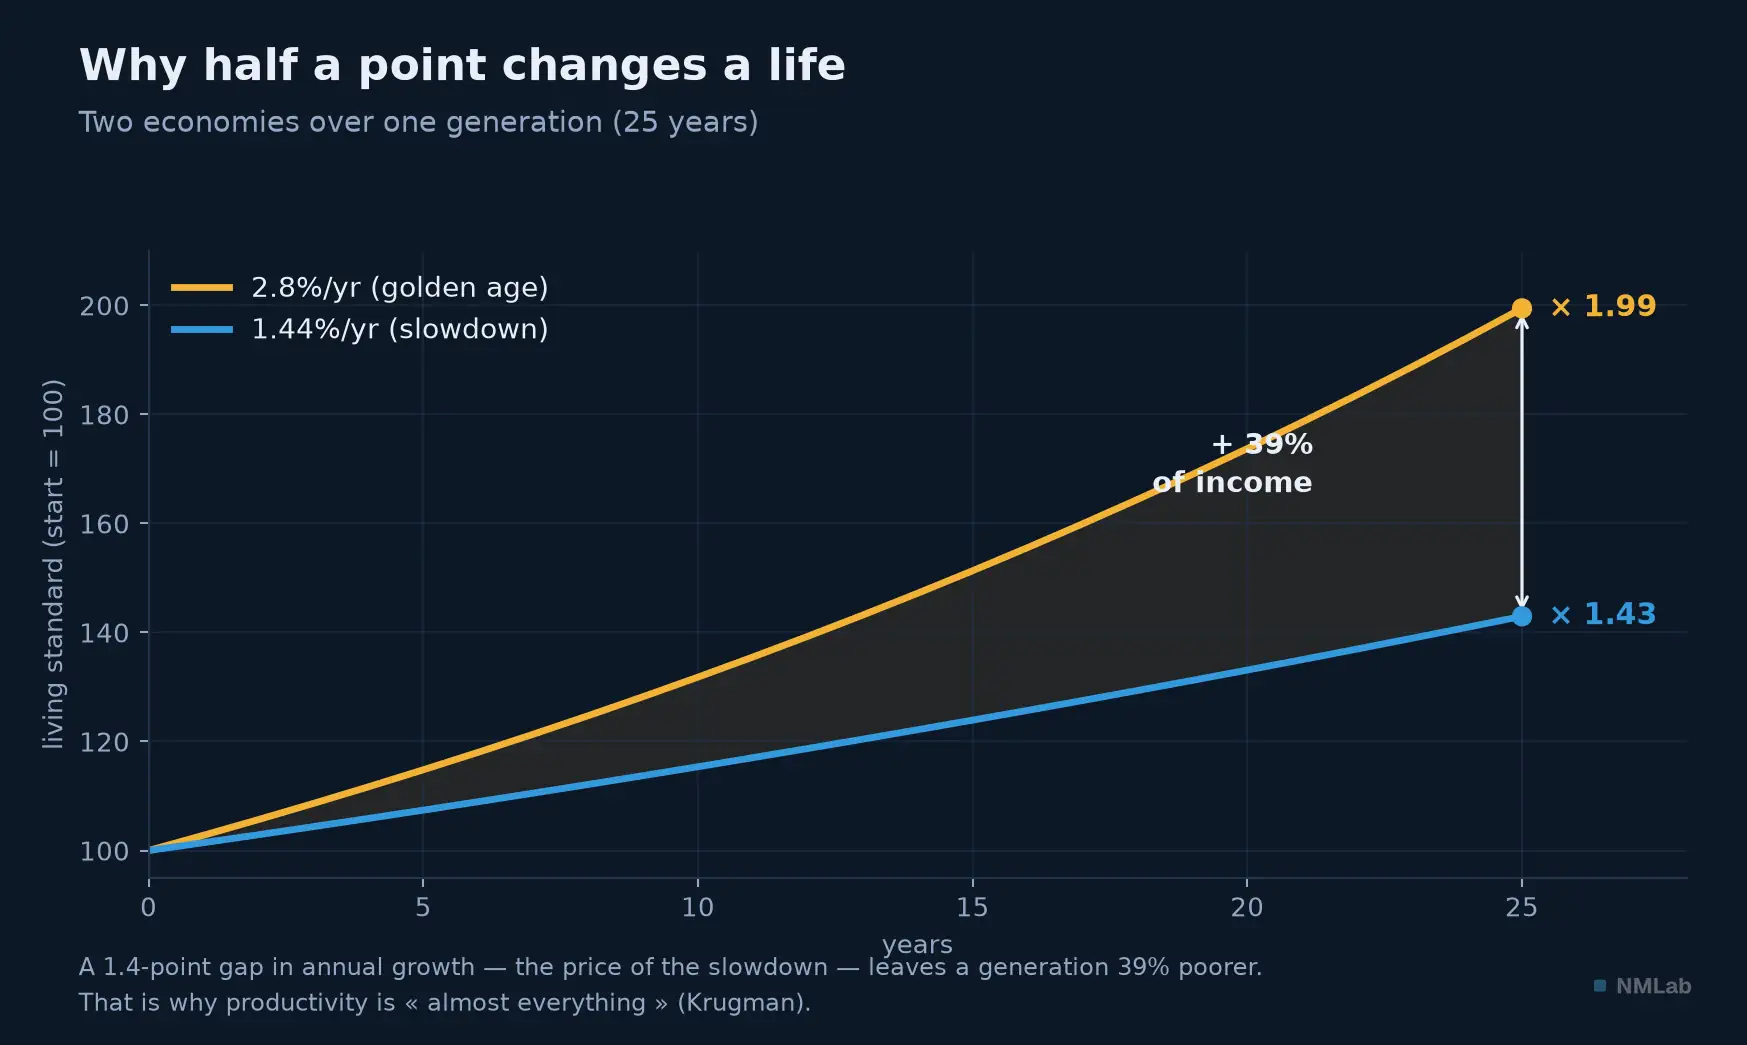
Two economies, a point and a half of difference in annual growth. After twenty-five years, one is 39% richer than the other. That is the whole drama of the slowdown.
Take the two regimes we have met: the golden age at 2.8% a year, the slowdown at 1.44%. The gap looks trivial — a point and a half. But let it run over one generation, twenty-five years. The golden-age economy multiplies its living standard by 1.99 — it doubles. The slowdown economy multiplies it by only 1.43. In the end, the first is 39% richer than the second. Thirty-nine percent: that is the difference between a generation that lives far better than its parents and one that treads water. It is the price, in flesh and income, of the productivity slowdown. And it is why this variable that never makes the headlines is, in the long run, the only one that truly counts.
Key takeaways
- Productivity = output per hour — Not "working more" but producing more per hour. In the U.S. it was multiplied by 5.2 since 1947: what took 1 hour takes 11.5 minutes today. The entire modern standard of living is there.
- Two engines — Capital deepening (more machines) and TFP, total factor productivity — pure progress, the "Solow residual." Only TFP grows an economy durably.
- The waves — Golden age (1948-73): 2.8%/yr. Slowdown (1973-95): 1.44%, with TFP collapsed to 0.30%. IT boom (1995-2005): 3.0%. Second slowdown since 2005.
- The Solow paradox — "You can see the computer age everywhere but in the productivity statistics" (1987). The lesson of the dynamo (Paul David): a general technology pays only when organizations remake themselves around it — a generation later. A direct lens for AI.
- Why it slows — Three suspects: ideas are harder to find (Bloom et al.: 18× more researchers to sustain Moore's Law); Baumol's cost disease (the Schubert quartet: 3 man-hours, then as now); and mismeasurement — a serious hypothesis, but ruled out by the sizing (Syverson, 2017: it would take ~$2.7tn a year).
- Who reaps? — Innovators capture only about 2.2% of the value created (Nordhaus); the rest goes to consumers. Productivity is a tide that lifts the index, not a premium for those who "bet on innovation."
The journey ahead
We have just seen that every general technology — electricity yesterday, the computer the day before — takes a generation to make good on its productivity promises. The question then burns of its own accord: what about artificial intelligence? Is it the dynamo of our century, bound for a deferred but colossal takeoff, or a revolution that, like so many others, will leave the growth statistics unmoved? Should we dread mass unemployment or hope for it as the sign of productivity finally regained? That is the whole subject of the next chapter: "AI, automation and productivity." One question to sit with in the meantime: what has your country's productivity growth rate been over the last ten years? Eurostat and the OECD publish it country by country, under "labour productivity per hour worked." You have just learned that this discreet figure decides, more than any other, the world in which you will grow old.
Sources and references
- Paul Krugman, The Age of Diminished Expectations: U.S. Economic Policy in the 1990s, MIT Press (1st ed. 1990), chapter one "Productivity Growth" — "Productivity isn't everything, but in the long run it is almost everything."
- Robert M. Solow, "We'd Better Watch Out," review of Manufacturing Matters (Cohen & Zysman), New York Times Book Review, July 12, 1987, p. 36 — "You can see the computer age everywhere but in the productivity statistics."
- Paul A. David, "The Dynamo and the Computer: An Historical Perspective on the Modern Productivity Paradox," American Economic Review 80(2), Papers and Proceedings, May 1990, pp. 355-361 — the diffusion of electricity and the decisive role of the "unit drive" and factory reorganization.
- William J. Baumol & William G. Bowen, Performing Arts: The Economic Dilemma, The Twentieth Century Fund, 1966, p. 164 — the Schubert quartet and the cost disease; complemented by W. J. Baumol, The Cost Disease, Yale University Press, 2012, for the sustainability argument.
- Nicholas Bloom, Charles I. Jones, John Van Reenen & Michael Webb, "Are Ideas Getting Harder to Find?", American Economic Review 110(4), April 2020, pp. 1104-1144 — 18× more researchers for Moore's Law; research productivity falling 5.3%/yr.
- Chad Syverson, "Challenges to Mismeasurement Explanations for the US Productivity Slowdown", Journal of Economic Perspectives 31(2), 2017, pp. 165-186 — the four objections to the mismeasurement hypothesis, including the missing order of magnitude (~$2.7tn/yr); David M. Byrne, John G. Fernald & Marshall B. Reinsdorf, "Does the United States Have a Productivity Slowdown or a Measurement Problem?", Brookings Papers on Economic Activity, Spring 2016 — mismeasurement exists but has not worsened alongside the slowdown.
- William D. Nordhaus, "Schumpeterian Profits in the American Economy: Theory and Measurement", NBER Working Paper 10433, April 2004 — innovators capture ~2.2% (range 1.3-3.3%) of the social value of innovation, 1948-2001.
- Figure data: BLS via FRED — output per hour of the nonfarm business sector (OPHNFB) and total factor productivity (MFPNFBS); average annual growth rates computed by period. Electricity diffusion after Paul David (1990); Moore's Law after Bloom et al. (2020); captured share after Nordhaus (2004). Vintage of July 16, 2026.