16. Saving and Investment: The Two Engines Financing the Economy
· Updated on · 17 min read
Richmond, Virginia, March 10, 2005. A still little-known Federal Reserve governor, Ben Bernanke, steps up to the podium of the Virginia Association of Economists to solve a puzzle that is obsessing the markets. For a year the Fed has been raising short-term rates; yet long-term rates refuse to rise — they are even falling. A few weeks earlier the Fed chairman, Alan Greenspan, admitted to Congress that he did not understand it. Bernanke offers an explanation in three words.
The world, he says, is suffering from a global saving glut. Whole countries — China, the oil exporters, an aging Japan — save more than they invest at home, and pour the surplus into American bond markets. This tide of saving, Bernanke concludes, "helps to explain both the increase in the U.S. current account deficit and the relatively low level of long-term real interest rates in the world today."
Twenty years on, we know what that explanation got right, and what it missed. It described a durable truth: saving looks for a home, and its abundance crushes rates. But it hunted for the excess saving abroad, when a decisive part was hiding inside the rich countries themselves — in the portfolios of their wealthiest 1%. This chapter follows saving on its trail, from where it comes from to where it goes, because saving, and the investment it funds, decide the price of every asset you own.
At a glance — Level: Advanced · Prerequisites: chapter 9 and chapter 11
By the end of this chapter, you will be able to:
- explain why S = I is an accounting identity and not a law of causation;
- locate the saving glut that has pushed interest rates down for a generation;
- see why Europe does not invest less than America, but invests in something else.
The passages marked "the detail" deal with measurement questions; the conclusions hold without them.
S = I: the identity that traps everyone
Let's start with the most misunderstood equation in macroeconomics. Take the formula from chapter 9, GDP = C + I + G + (X − M); a little algebra, a closed economy, and out comes an identity: saving equals investment, S = I. Always — like the fact that every sale is a purchase.
The moment the economy is open, however, the identity gains a term, and it must not be dropped: S = I + the external balance. A country that saves more than it invests lends to the rest of the world; a country that invests more than it saves borrows from it. The United States is in the second case, with a current-account deficit of three to four points of GDP. Its two figures for early 2026: $5,490 billion of gross saving, $5,634 billion of gross private domestic investment. Close — but don't jump to conclusions: that closeness owes as much to the perimeters chosen as to the accounting, not to the identity itself. The chart below indeed shows two curves that share the cycle without ever overlapping: the gap is the government and the rest of the world. Remember the full formula, never the closed-economy version.
And this is where the trap snaps shut. From "S = I" people believe they can deduce that "saving finances investment," hence that saving more enriches the country in capital. The shortcut is nearly irresistible, and it is wrong — or at least, it confuses two things. The identity S = I is true after the fact, once the year is counted; the loanable-funds market — the idea that the interest rate adjusts to equalize the desire to save and the desire to invest — is a theory, and a debatable one. Keynesians even object that the causality runs the other way: it is investment that, by distributing incomes, creates the saving needed to match it. You already met this reversal in chapter 3, with the paradox of thrift: what is virtuous for one household — setting money aside — can, if everyone does it at once, collapse demand and reduce the saving of the whole. Hold on to the distinction, because it separates the beginner from the professional: the accounting equality does not tell you who is in charge; it says only that, once the year is over, the two pans of the scale have balanced — through rates, through incomes, through bankruptcies if need be.
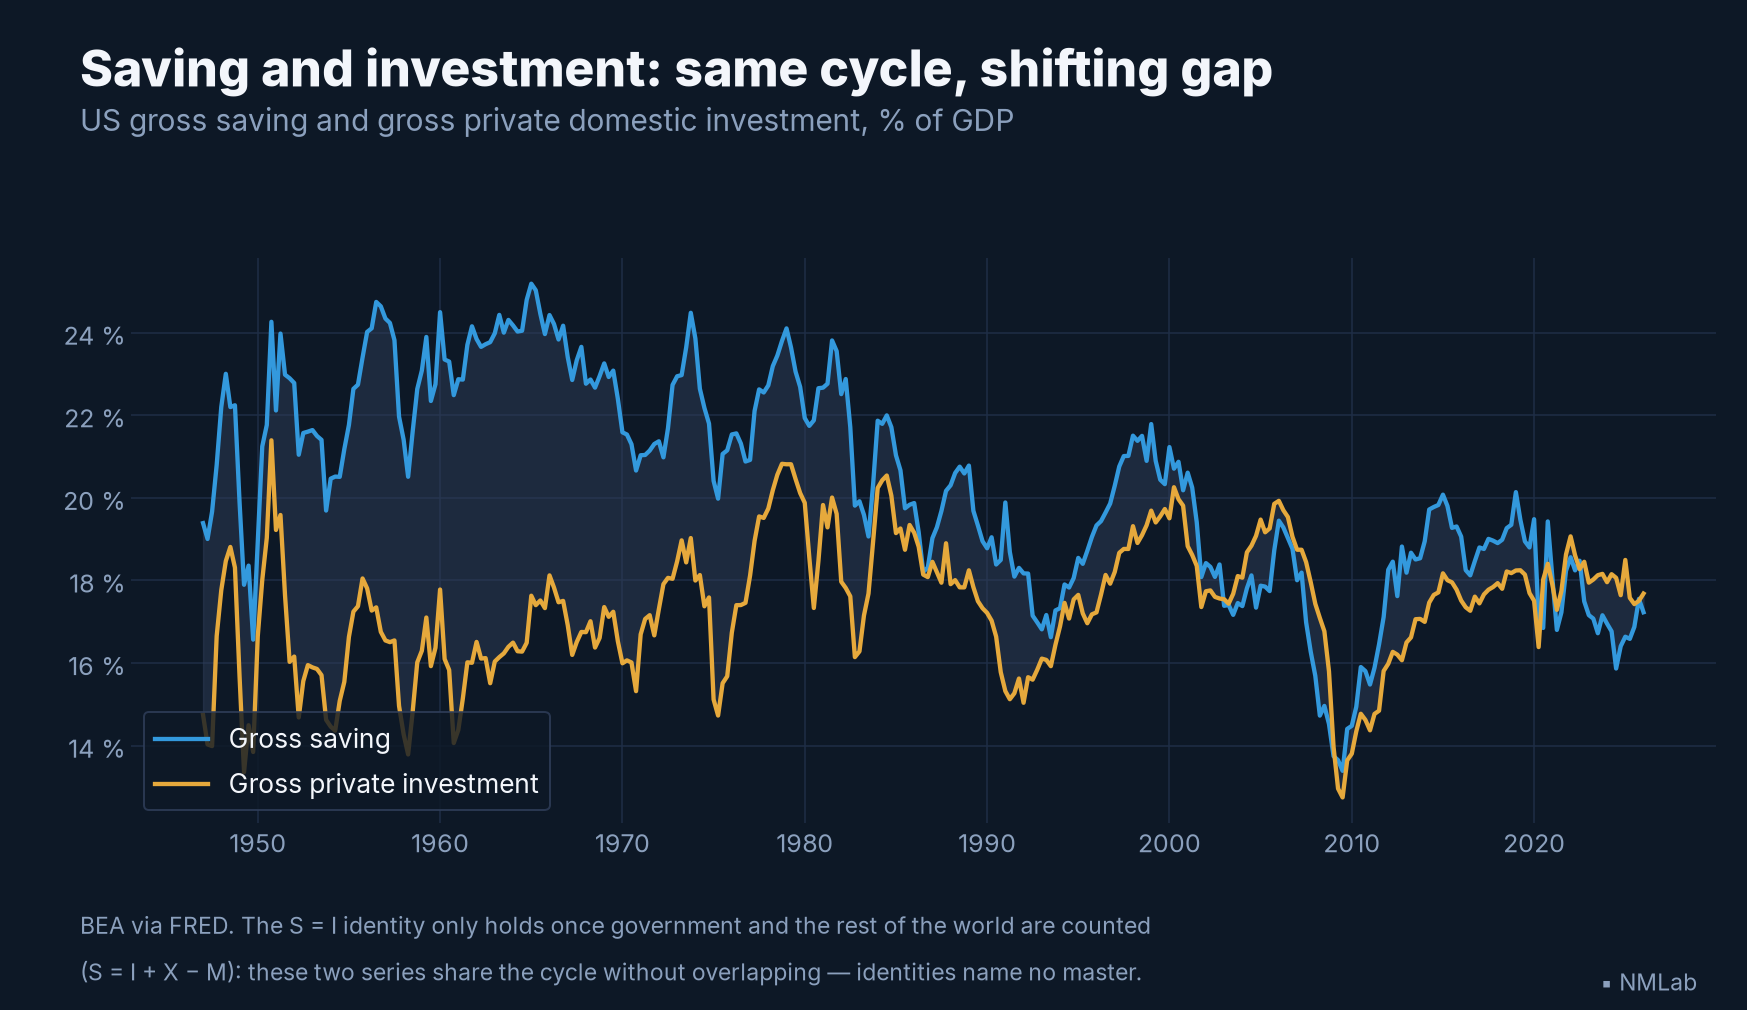
The two pans share the cycle without ever overlapping: the gap is government and the rest of the world. An accounting identity is not a law of causation.

The first term, household saving, has a history that contradicts every virtue ascribed to it. In the United States, the household saving rate fell to 3% of disposable income in the spring of 2026 — two and a half times below its long-run average of 8.4%; it was 11% in the 1960s. The only recent jolt, the leap to nearly 32% in the spring of 2020, was forced saving — Treasury checks you couldn't spend, a country in lockdown — and it drained away as fast as it had come.
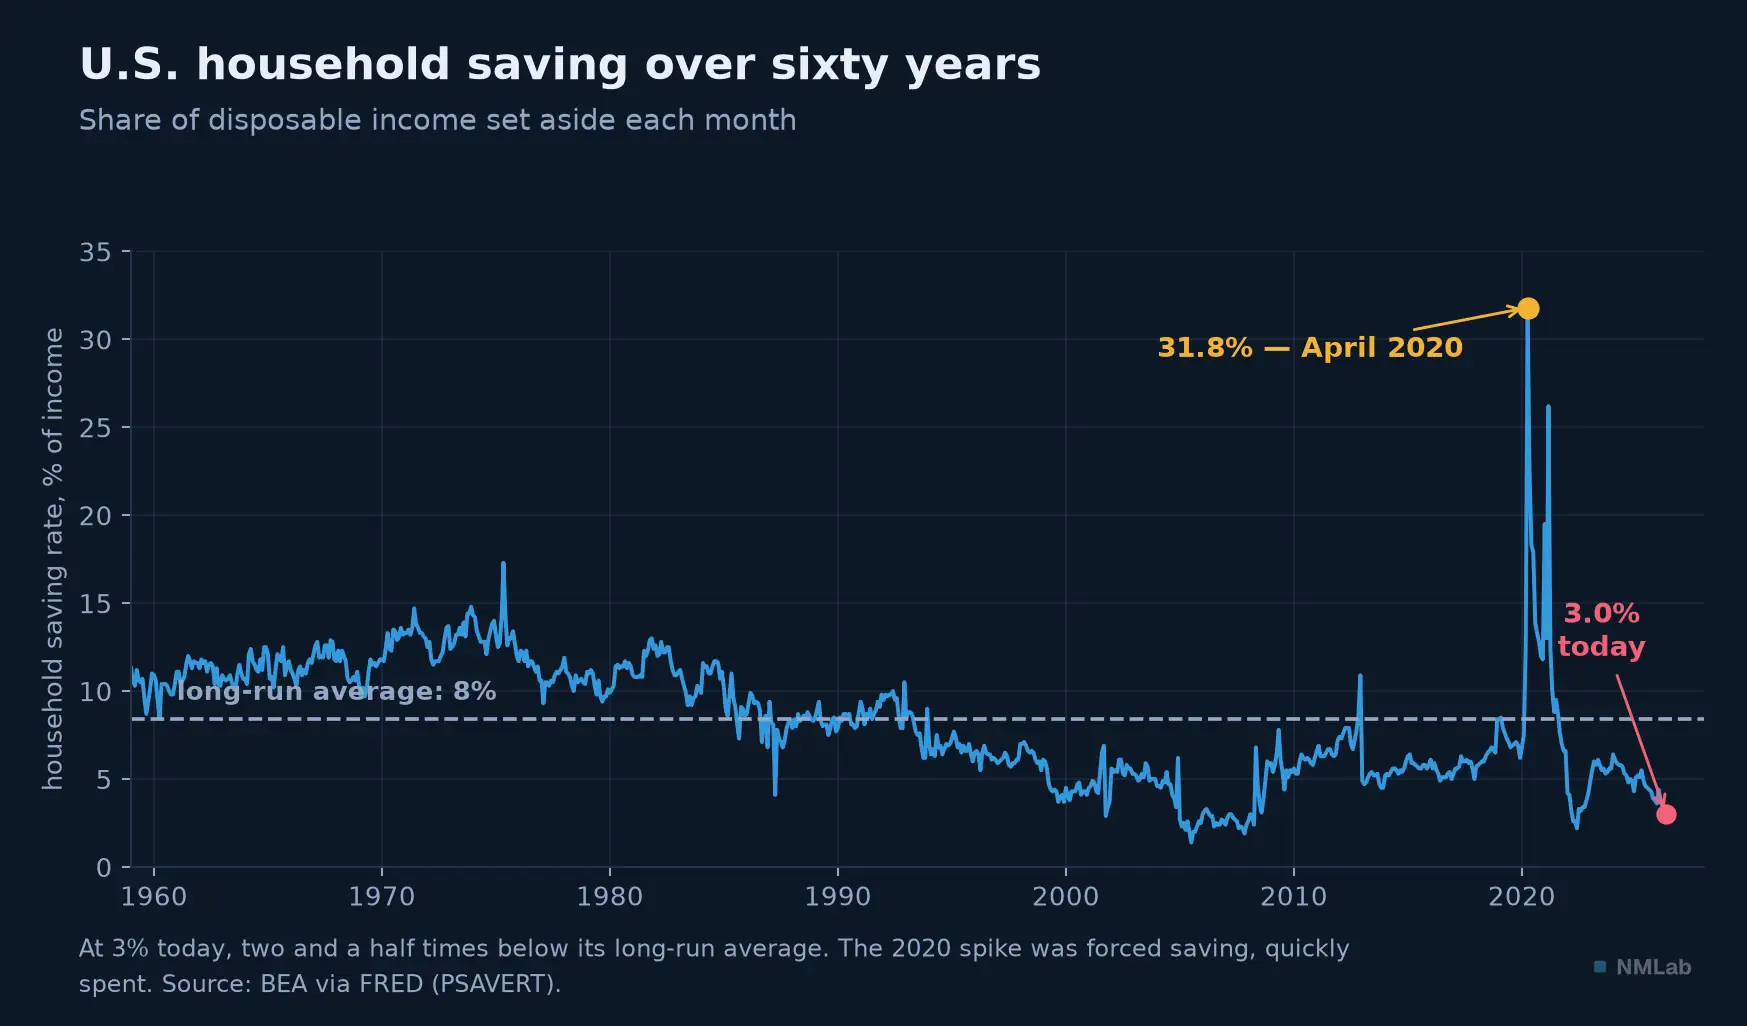
At 3%, the average American saves two and a half times less than over the long run. The 2020 spike was a parenthesis, not a turning point.
Where saving goes — and the glut of the rich
If American households save so little, where does the abundance of saving Bernanke described come from? His answer — from abroad — was right, but incomplete. The most striking work of the last decade on this question flushed out the other source, and it is domestic. Atif Mian, Ludwig Straub and Amir Sufi did something simple and devastating: they broke down American saving by wealth bracket. The result upends intuition. The richest 1% save more than 40% of their disposable income; the next 9%, 20%; the upper middle class — the 51st to 90th percentile — 12%. And the bottom half? Roughly nothing: it lives hand to mouth. Saving, in America, is not an evenly spread virtue; it is a function of wealth, and so, as incomes have concentrated since the 1980s, a flow that has exploded at the top. The saving surplus of the top 1% alone rose by nearly 3 points of national income after 1982 — more than $680 billion a year.
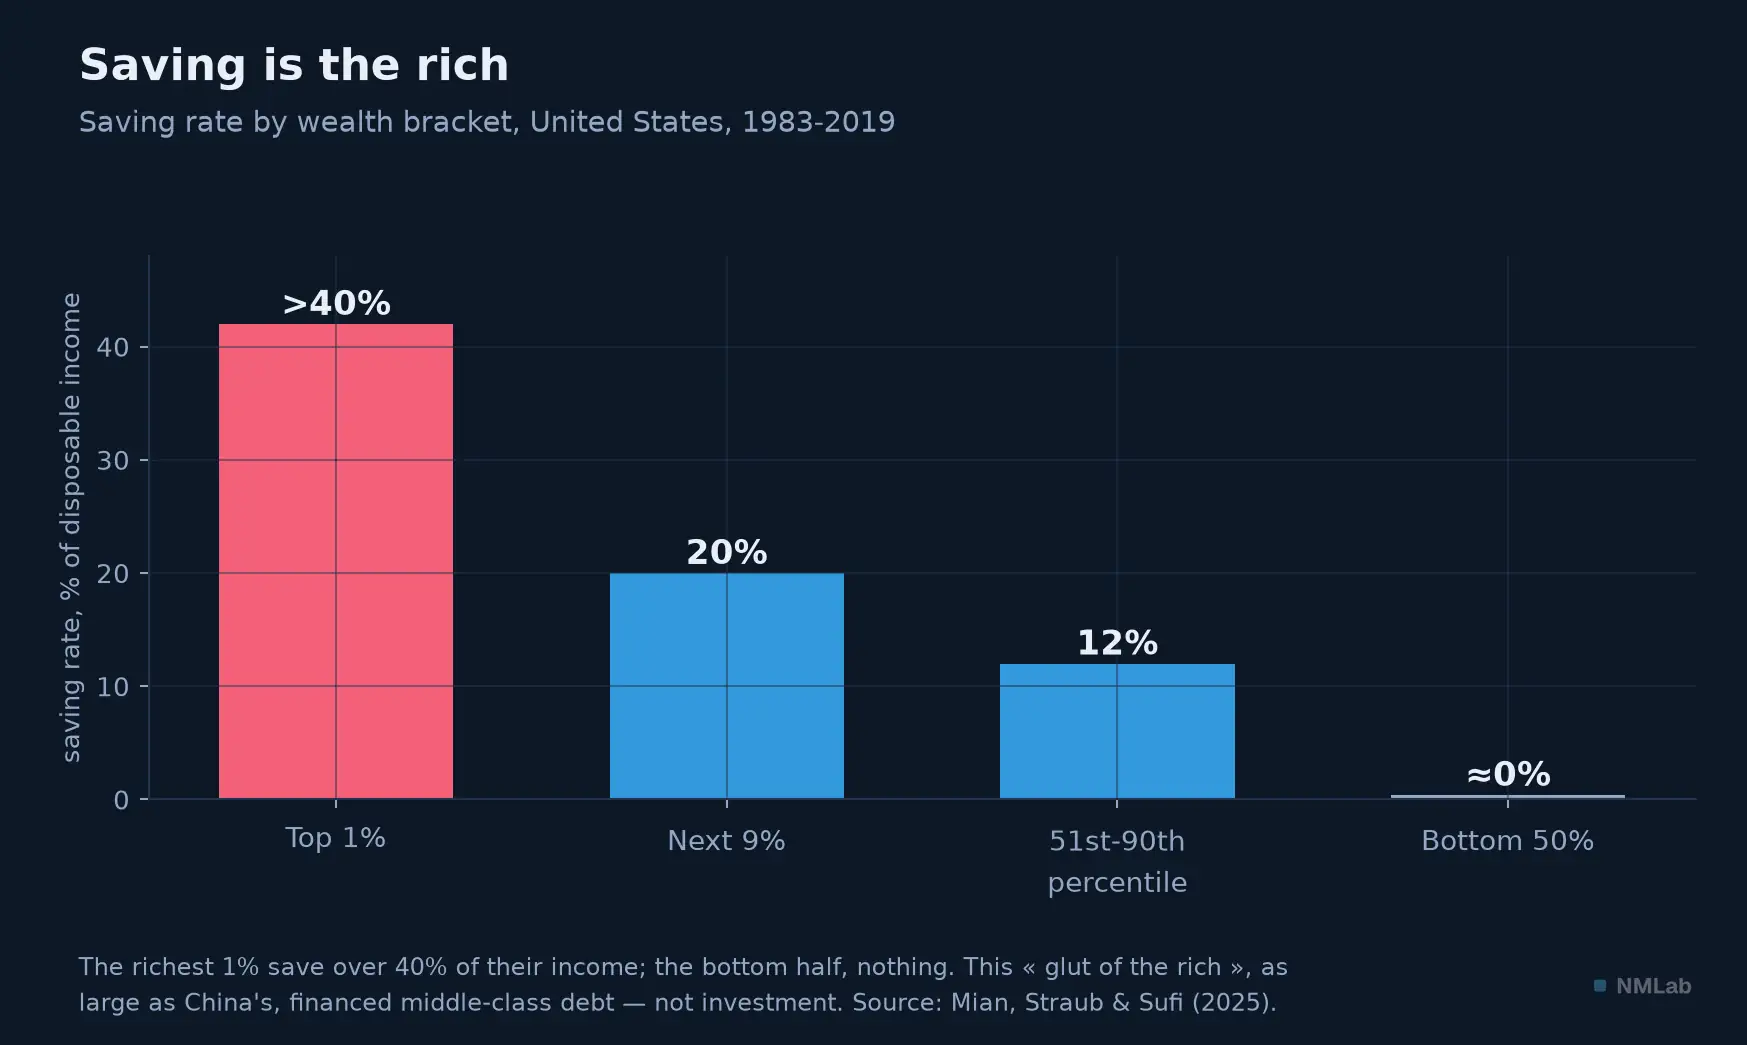
American saving is a phenomenon of the rich. The "glut of the rich" matches in size Bernanke's global saving glut.
The authors call this the saving glut of the rich — and the word is not chosen at random: it is as large, and as influential, as Bernanke's global glut. Beware the misreading, though: they do not say "it's not China, it's the rich." The two gluts coexist and add up. What Mian, Straub and Sufi fault in the classic analysis is that it reasons on a country's aggregate saving, which "obscures critical within-country shifts." The lesson is methodological: a widening inequality can produce, without a single dollar of foreign capital, the same excess saving and the same low rates.
And here is the punch line, the one that makes this chapter more than an accounting curiosity: this saving did not finance investment, it financed debt. Until 2008, the saving of the rich fueled the borrowing of the middle class — mortgages, credit cards; after 2008, the deficits of the federal government. The authors put it in a sentence that ought to appear in every textbook: "Rather than channeling the savings of the household sector into investment by the business sector, the growth in finance since the 1980s appears to be driven to a large degree by the channeling of savings by some households into borrowing by other households." The saving of some financing the debt of others: the exact inverse of the loanable-funds fable.
A variant of the same error waits for anyone watching international flows. Bernanke read the net surpluses and deficits — the current accounts. Hyun Song Shin showed, in 2011, that the essential slips through: European banks were borrowing massively in dollars in the United States to re-lend there, inflating American credit without anything showing up in a roughly balanced euro-area current account. It was, he says, less a global saving glut than a global banking glut — an excess of bank credit, invisible to the net accounts. The debate is not settled, and its merit lies elsewhere: look at gross flows, not balances, for a country can look sober on net and pour torrents of credit gross.
The natural rate, or why money cost nothing anymore
All this saving looking for a home has a price: the interest rate. And not just any rate — the natural rate of interest, the real rate that would balance an economy running at full tilt without overheating, the one economists write r*. It is the compass of central banks, and it went haywire: over a generation, this natural rate plunged. By how much? Łukasz Rachel and Lawrence Summers estimated it for the industrial world as a whole: the neutral rate fell by at least 300 basis points in one generation; and if you isolate the "private sector" component alone — stripping out the effect of public debts and pensions, which propped it up — the drop reaches as much as 700 basis points. It is colossal. It is what Summers, in a now-famous speech at the IMF on November 8, 2013, rebaptized secular stagnation: a world where the rate consistent with full employment has become so low, perhaps negative, that even a bubble is no longer enough to overheat the economy. His observation on the pre-crisis years still chills: "Was there a great boom? Capacity utilization wasn't under any great pressure. Unemployment wasn't at any remarkably low level. Inflation was entirely quiescent. So, somehow, even a great bubble wasn't enough to produce any excess in aggregate demand."
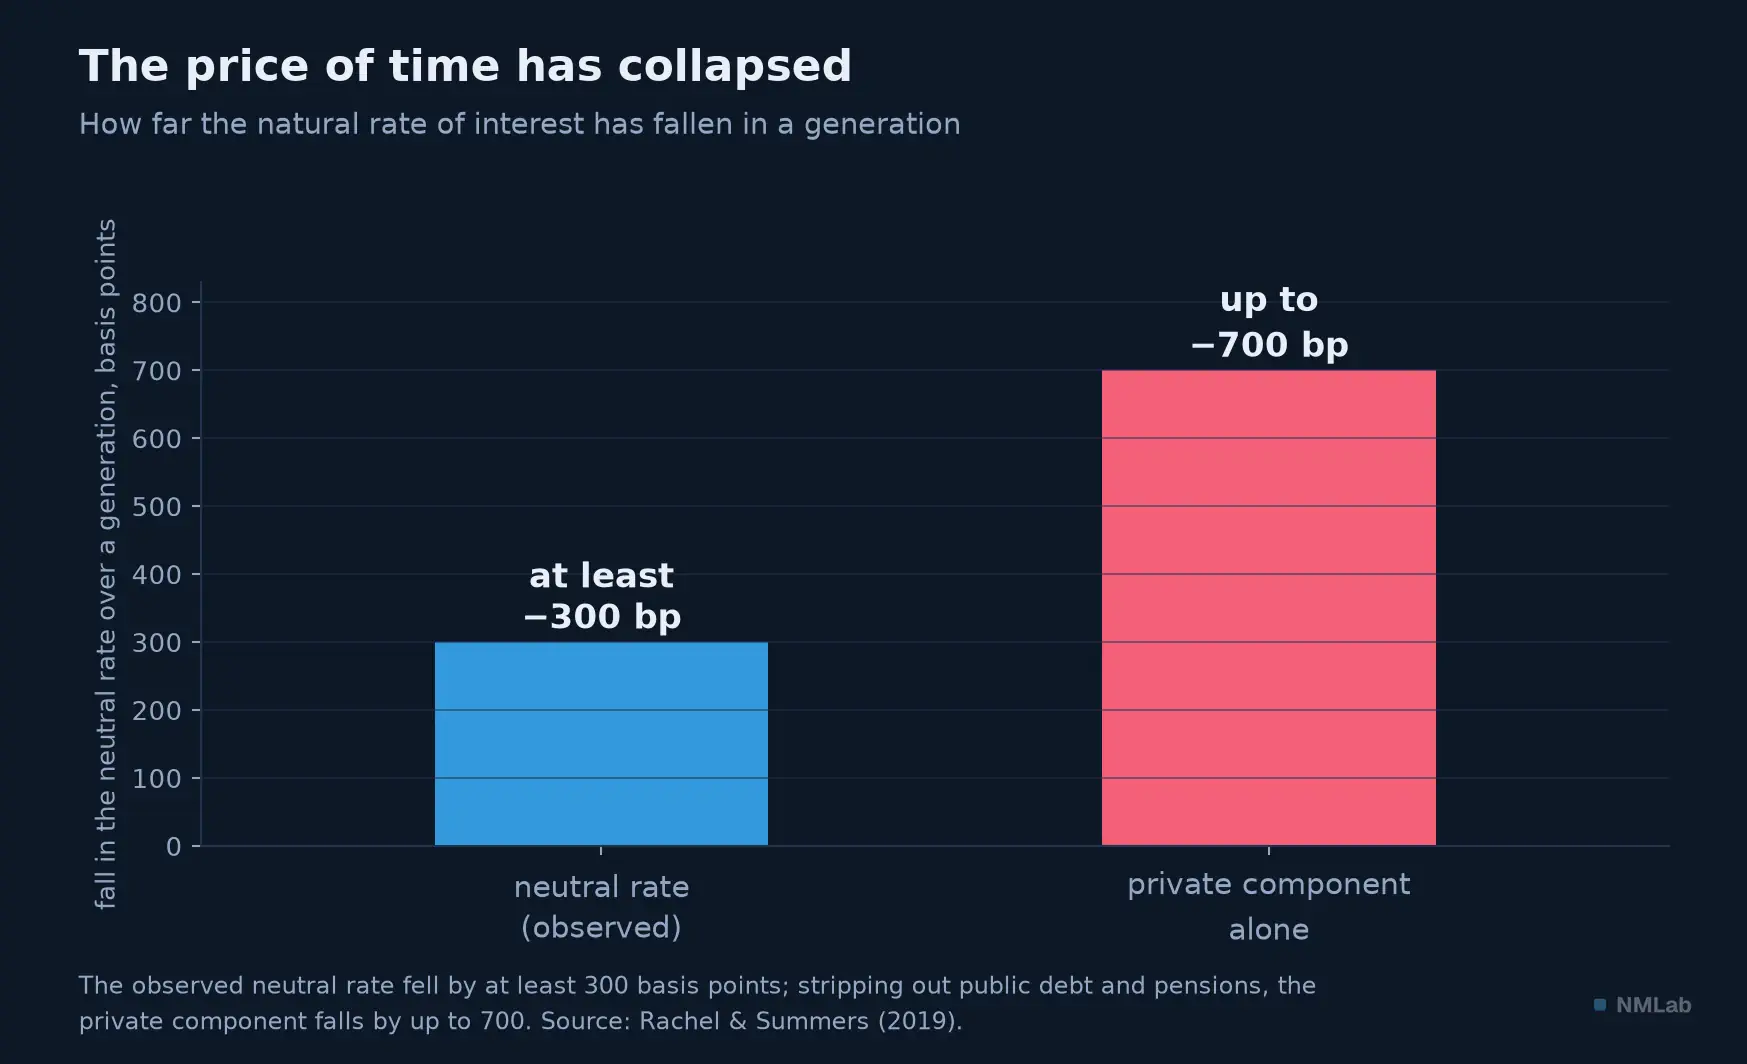
The price of time collapsed in a single generation. It is the shadow cast by this fall that lifted the price of every asset.
Where does this fall come from? From forces you have already met: the excess saving, of the rich as of China; aging (chapter 14), whole populations saving for long retirements; the slowdown in productivity and demography, which leaves fewer opportunities to invest. And above all — the link is mechanical — because the natural rate tracks trend growth, point for point. Chapter 11 established it: in central banks' reference model, r* is written as the sum of long-run growth and a residual, with a coefficient fixed at one. Less growth, less natural rate. It is no accident that the chapters on growth, demography and saving all end up flowing into the same tap.
One question remains open, and it must be left open: is this natural rate finally rising again? Some think so — the ECB observes it for the euro area. Others stay cautious: Kathryn Cho and John Williams, at the New York Fed, estimate that r* has recovered "only a quarter to a half point" since 2018, and conclude that "the low r-star era is far from over." The models themselves are at war: in the same quarter of 2026, one of the Richmond Fed's estimators puts the U.S. real natural rate at 1.74%, the New York Fed's at 1.06% — almost a full point apart for a quantity that cannot be observed. Remember the chapter on the output gap: r*, like potential growth, is a map, not the territory.
Investment: Europe doesn't do less, it does something else
Let's cross to the other side of the identity. If saving is abundant, is investment up to the task? Everywhere you read that Europe "doesn't invest enough," that it is falling behind the United States. The exact figure tells a subtler — and more disturbing — story. In 2025, the total investment rate of the European Union is 21.4% of GDP, that of the United States 21.3%: they are near identical, Europe is even very slightly above. The much-discussed gap is therefore not a gap in level, it is a gap in composition. Europe invests more in bricks — 5.0% of GDP in housing, against 3.9% in the United States; and America invests far more in intangibles — patents, software, research and development: 6.8% of GDP, against 4.4% in Europe. A gap of more than half, precisely on what builds tomorrow's productivity.
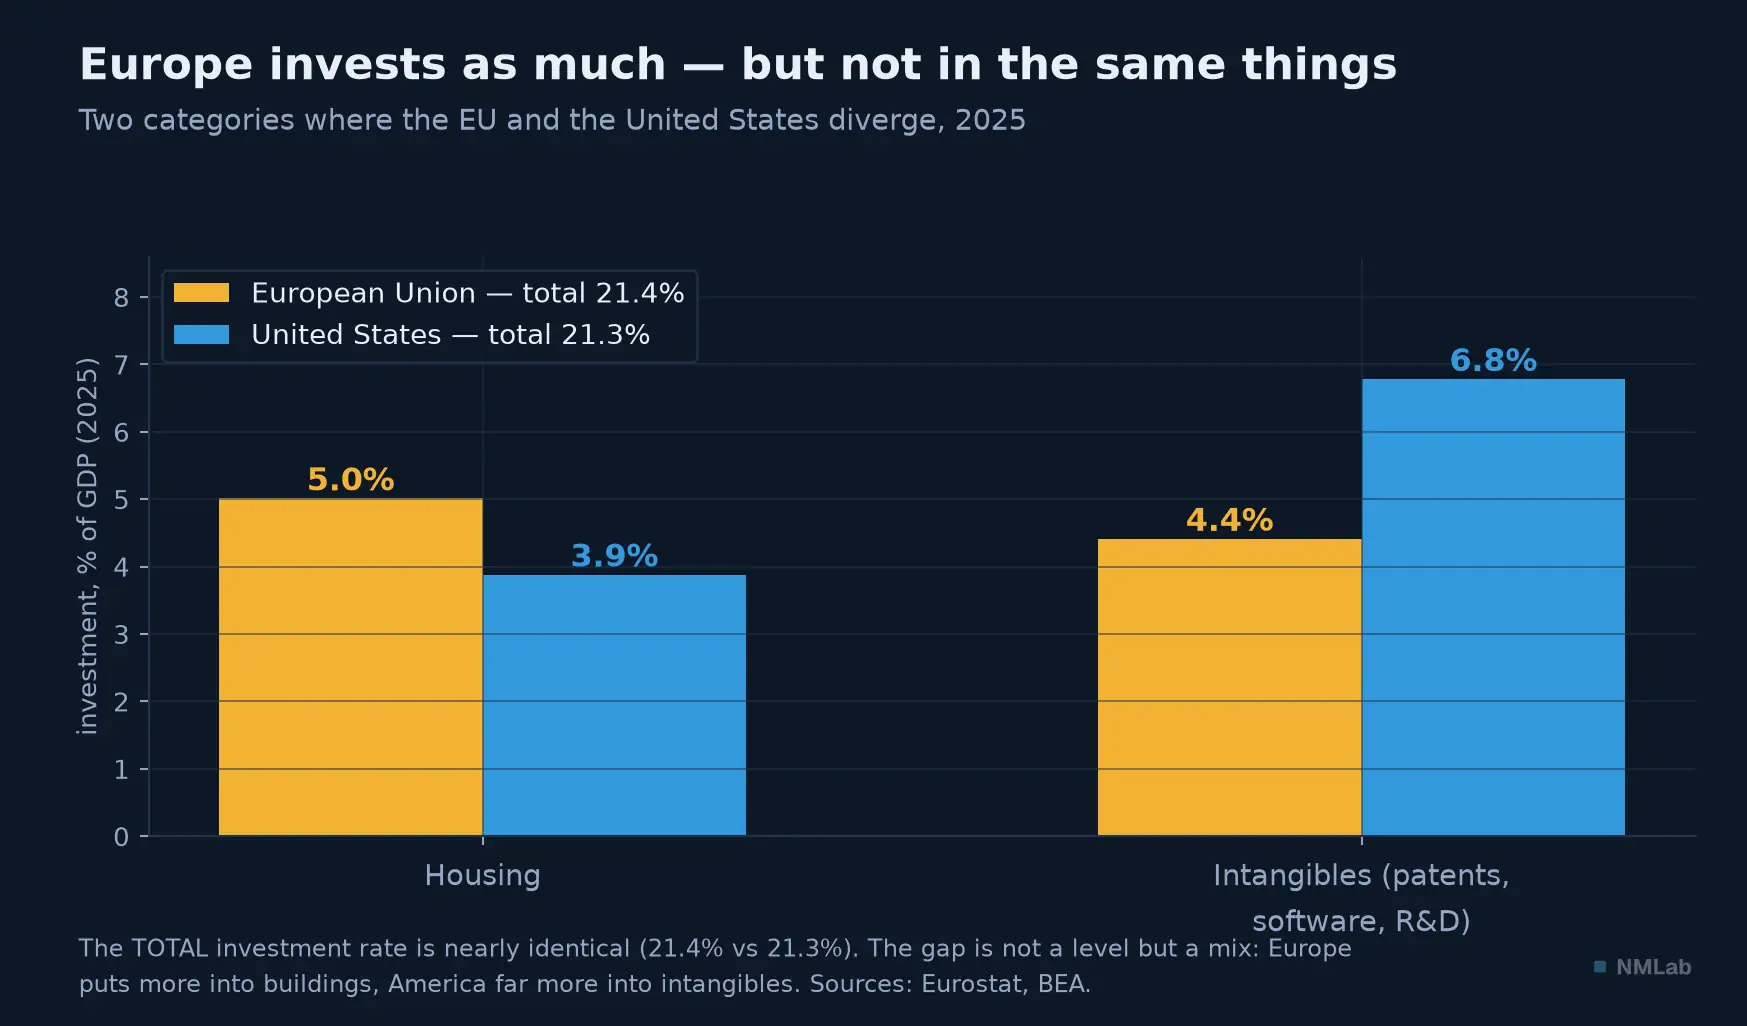
Same total amount, two opposite bets: Europe in concrete, America in ideas.
The detail: a comparison never to make — A technical trap here catches more than one person — including seasoned journalists. You often read that "American private investment is only 17.7% of GDP," a figure lower than the European rate, from which people conclude that America invests less. This compares incompatible quantities: the American 17.7% is private investment, inventories included; the European rate is total capital formation, public and private, excluding inventories. Comparing the two is comparing a third of a cake to a whole pie. The right comparison, the one in the chart, gives equality.
It is this diagnosis — a problem of composition and productivity, not of amount — that Mario Draghi's report hammered home in September 2024. Europe, he writes, needs "a minimum annual additional investment of EUR 750 to 800 billion," or 4.4 to 4.7% of EU GDP; for reference, the Marshall Plan was worth 1 to 2%. The investment rate would have to rise from "around 22% to around 27% of GDP." And beware of quoting this dated figure without dating it: as early as July 2025, under the weight of the defense commitments made at The Hague, the ECB raised the need to nearly EUR 1,200 billion a year for 2025-2031 — a figure Draghi himself took up in September 2025.
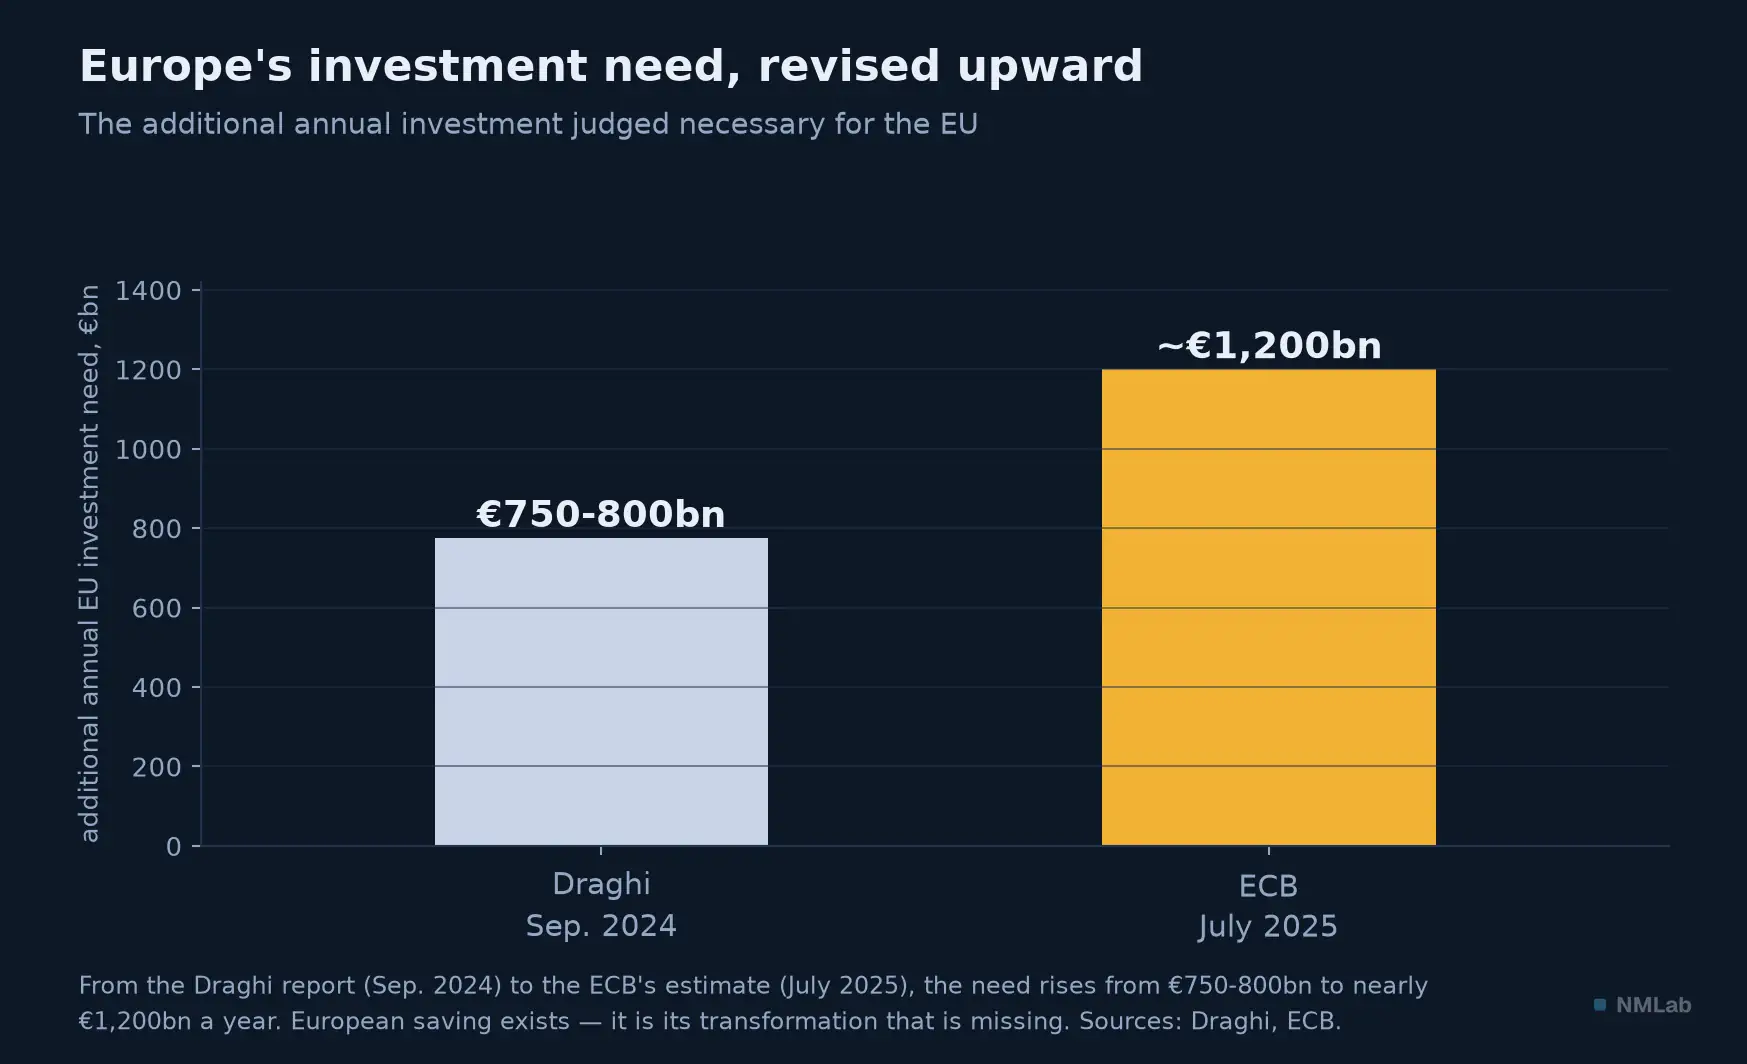
European saving does exist — EU households set aside more than Americans. What is missing is the pipe that would turn it into productive investment.
European saving does exist, and in bulk: EU households saved €1,390 billion in 2022, against $840 billion in the United States — the figures the Draghi report uses, and the last year in which the two zones are measured on a directly comparable basis. Europe's problem is not a lack of saving. It is a failure to turn it into productive investment — precisely the link that the loanable-funds market assumes automatic, and which is not.
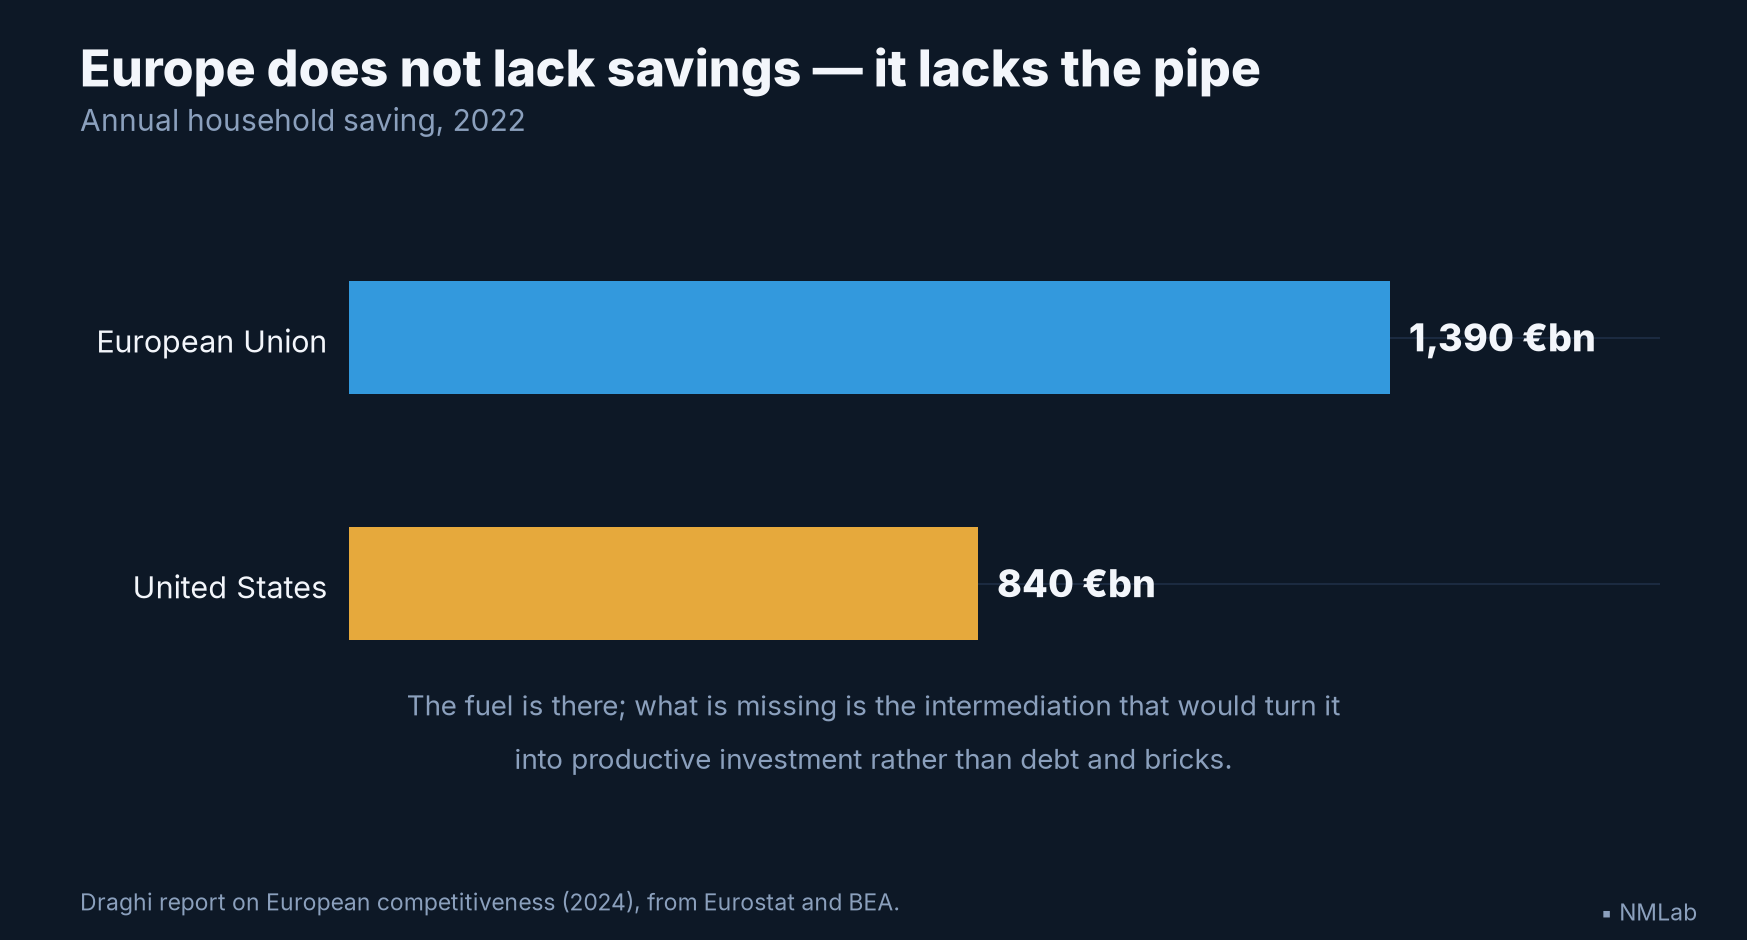
Europe's fuel exists, and it exceeds America's. What is missing lies downstream: the pipe that would carry it to intangibles rather than to bricks and debt.
What it changes for a portfolio
Three consequences, and you already half hold them. The first is that abundant saving and a low natural rate have a direct effect on your investments: they support the price of every asset. Chapter 11 showed it — the value of an asset is a future flow divided by a rate; when that discount rate sags for a generation, stocks, bonds and real estate rise together, not because they are worth more, but because you are dividing by less. The great rise in valuations since the 1980s is, in large part, the shadow cast by the fall of r*. The second is that your saving does not sleep: the financial system — life insurance, pension funds, banks — is nothing but a pipe that turns household saving into financing for firms and governments, and that is where Europe's fate is decided, for it has the fuel but lacks the intermediation engine that would steer it toward intangibles rather than toward bricks and sovereign debt.
The third, the subtlest, is that saving determines the rate, and the rate determines everything else. If Rachel and Summers are right and the natural rate stays lastingly low, the era of generous bond yields will not return anytime soon, and yield will have to be sought in risk; if those who see a rebound are right, two decades of valuations inflated by low rates could deflate. This debate, which no one has settled, is not academic: it is the most important question for anyone investing money over ten or twenty years. One last word, echoing the "glut of the rich": if saving concentrates at the top and finances debt rather than investment, then weak demand is not an accident, it is structural, and it calls for either more debt or more public spending to fill the hole. That is exactly the debate awaiting you in the next module, on sovereign debt. Saving is never neutral: it decides who lends, who borrows, and at what price the whole world finances itself.
Key takeaways
- S = I is an identity, not a law of causality — And only in a closed economy: once it is open, the identity reads S = I + the external balance. But "saving finances investment" is a theory (the loanable-funds market) that Keynesians reverse: it is investment that creates saving.
- American household saving is low and concentrated — 3% of income (May 2026), against 8.4% on long-run average. And it is a phenomenon of the rich: the top 1% save more than 40% of their income, the bottom half nothing.
- The glut of the rich — The excess saving of the wealthiest 1%, as large as China's, financed the debt of the middle class, not investment: "channeling of savings by some households into borrowing by other households" (Mian, Straub & Sufi).
- The natural rate plunged — By at least 300 basis points over a generation, up to 700 points for its private component (Rachel-Summers). Summers's secular stagnation: even a bubble was no longer enough to overheat. The natural rate tracks trend growth point for point.
- Europe doesn't invest less, it invests differently — Near-identical total rate (21.4% vs 21.3%), but Europe puts more into bricks, America far more into intangibles (6.8% vs 4.4% of GDP). ⚠️ Never compare U.S. GPDI (17.7%) to the European rate: incompatible quantities.
- For your investments — Abundant saving and a low natural rate support the price of every asset. The great open question — is r* rising again? — decides your ten-year returns.
The journey ahead
You have followed saving from its source to its destination, and seen how it sets the price of time. One force remains that this path brushed against without confronting, and which now weighs on potential growth itself: climate. Not as a moral cause, but as a hard macroeconomic variable — capital destroyed, insurance premiums exploding, a new kind of inflation, assets that could strand. How does a risk that unfolds over decades enter markets that live quarter to quarter? Next chapter, and it is flagged "advanced": "Climate and macroeconomics: physical risk, transition and potential growth". One comparison while you wait: your country's saving rate against that of the United States. You have just seen, in a single figure, which economy lends to the rest of the world — and which borrows from it.
Sources and references
- Ben S. Bernanke, "The Global Saving Glut and the U.S. Current Account Deficit," Sandridge Lecture, Virginia Association of Economists, Richmond, March 10, 2005 — the global excess saving that explains low long rates and the U.S. current account deficit.
- Atif Mian, Ludwig Straub & Amir Sufi, "The Saving Glut of the Rich", NBER Working Paper 26941, April 2020 (revised July 2025) — saving rates by stratum (top 1% > 40%, bottom half ≈ 0), the glut of the rich as large as the global glut, and "the channeling of savings by some households into borrowing by other households."
- Hyun Song Shin, "Global Banking Glut and Loan Risk Premium," Mundell-Fleming Lecture, 12th Jacques Polak Annual Research Conference, IMF, November 2011; IMF Economic Review 60(2), 2012 — gross flows versus the net current account, and the "global banking glut."
- Lawrence H. Summers, speech at the IMF research conference, November 8, 2013 ("Have We Entered an Age of Secular Stagnation?," IMF Economic Review 63(1), 2015) — "even a great bubble wasn't enough to produce any excess in aggregate demand."
- Łukasz Rachel & Lawrence H. Summers, "On Secular Stagnation in the Industrialized World," Brookings Papers on Economic Activity, Spring 2019 — the fall of the neutral rate by at least 300 basis points, up to 700 for the private component.
- Kathryn Cho & John C. Williams, "Are Financial Markets Good Predictors of R-Star?," Liberty Street Economics, Federal Reserve Bank of New York, August 25, 2025 — the natural rate up "a quarter to a half point" since 2018; "the low r-star era is far from over." Lubik-Matthes (Richmond Fed) and Holston-Laubach-Williams (New York Fed) estimates for the disagreement between models.
- Mario Draghi, The Future of European Competitiveness, European Commission, September 9, 2024 — the need for EUR 750 to 800 billion a year (4.4-4.7% of EU GDP), raised to nearly EUR 1,200 billion by the ECB (blog of July 25, 2025) and taken up by Draghi on September 16, 2025; also the source for annual household saving (€1,390bn in the EU against $840bn in the United States in 2022).
- Figure data: BEA via FRED (PSAVERT, GSAVE, GPDI), Mian-Straub-Sufi (2025), Eurostat and BEA for EU/US investment; magnitude of the neutral-rate fall after Rachel & Summers (2019) — vintage of July 16, 2026.