17. Climate and Macroeconomics: Physical Risk, Transition and Potential Growth
· Updated on · 19 min read
May 2023, California. The state's largest home insurer, State Farm, announces it will stop writing new policies. In March 2024, it goes further: it will not renew about 72,000 contracts — houses, apartment buildings, businesses. The reason, laconic, fits in one word: risk. Wildfires, rebuilding costs, reinsurance gone prohibitive. Where insurance withdraws, climate risk stops being a distant abstraction: it becomes a price — or, worse, the absence of any market at all.
It is the best way into this chapter, because it does what finance does best: translate a risk into money. And it is exactly what a governor of the Bank of England, Mark Carney, announced back on September 29, 2015, in a founding speech delivered to the insurers of Lloyd's of London. Its title: "Breaking the Tragedy of the Horizon." Its thesis, chillingly lucid: "the catastrophic impacts of climate change will be felt beyond the traditional horizons of most actors — imposing a cost on future generations that the current generation has no direct incentive to fix." The business cycle is counted in years, the political cycle in terms of office, a central bank's horizon in a decade; climate unfolds over centuries. And Carney concludes: "once climate change becomes a defining issue for financial stability, it may already be too late."
This chapter, flagged "advanced," treats climate not as a moral cause, but as what it is to an investor: a hard macroeconomic variable. Capital destroyed, premiums exploding, a new kind of inflation, assets that could strand. Its place in this module is no detour: after hands (chapter 14) and productivity (chapter 12), climate is the third factor that shifts the potential growth of chapter 15 — by destroying capital, by diverting investment into adaptation, by rendering some capacity unusable. And, in keeping with this series' rule — follow the facts, even against the current — we will carefully distinguish what is solidly established from what is uncertain, exaggerated, or even, as we shall see, purely and simply retracted.
At a glance — Level: Advanced · Prerequisites: chapter 15
By the end of this chapter, you will be able to:
- tell apart the three climate risks — physical, transition, and the one always forgotten: liability;
- explain why estimates of the macroeconomic cost vary by a factor of ten, and how to handle them;
- name where climate already enters prices: insurance premiums, inflation, stranded assets.
Three risks, not two
First correction, and a big one. The press always sums up climate risk in two categories: physical and transition. Carney distinguishes three, and the third is almost always forgotten. The physical risk, first: the direct damage of climate events — floods, storms, droughts — that destroy capital and disrupt activity. The transition risk, next: the assets that a shift to a low-carbon economy would devalue, when a change in policy, technology or market sentiment forces a sudden re-rating of entire sectors. And the third, the great forgotten one: the liability risk — the claims that those who have suffered climate damage would file, tomorrow, against those they hold responsible. "Such claims could come decades in the future," Carney writes, "but have the potential to hit carbon extractors and emitters — and, if they have liability cover, their insurers — the hardest." A climate lawsuit can do to a balance sheet what a hurricane does to a house.
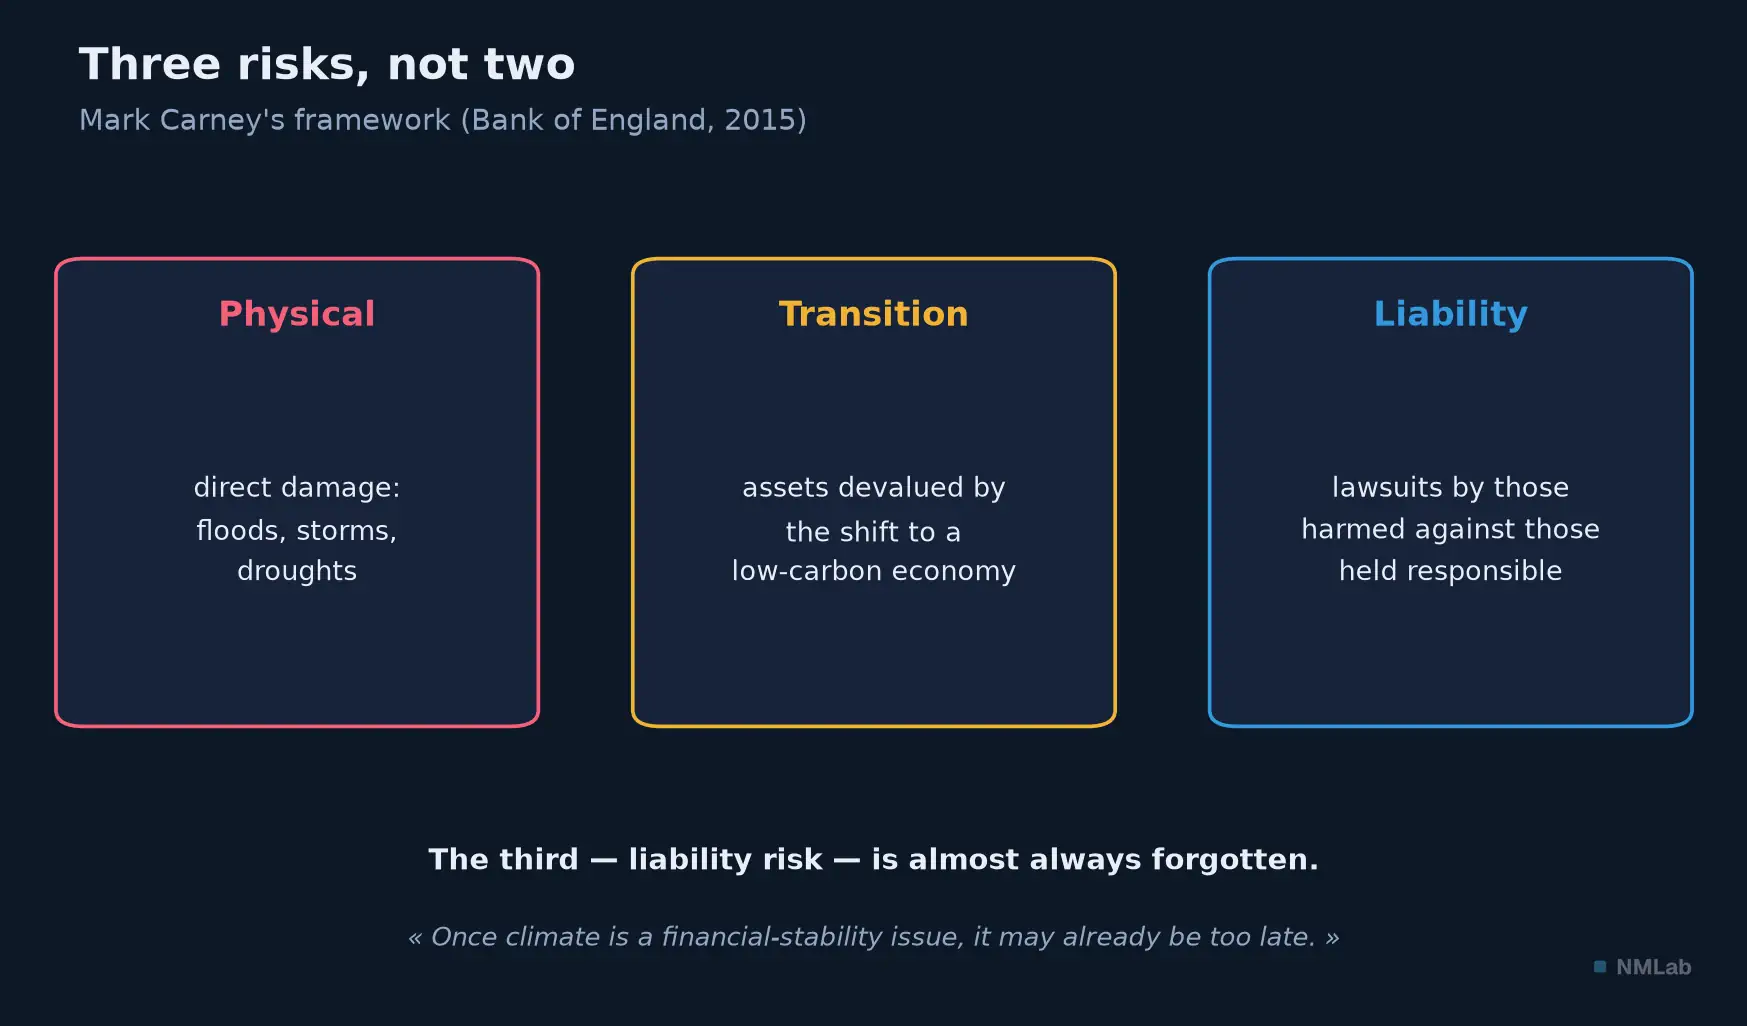
Three channels, not two: liability risk — climate lawsuits — is the one missing from most analyses.

The physical fact, and its bill
Let's start with what is not in dispute. The planet's average temperature is rising, and the pace is accelerating.
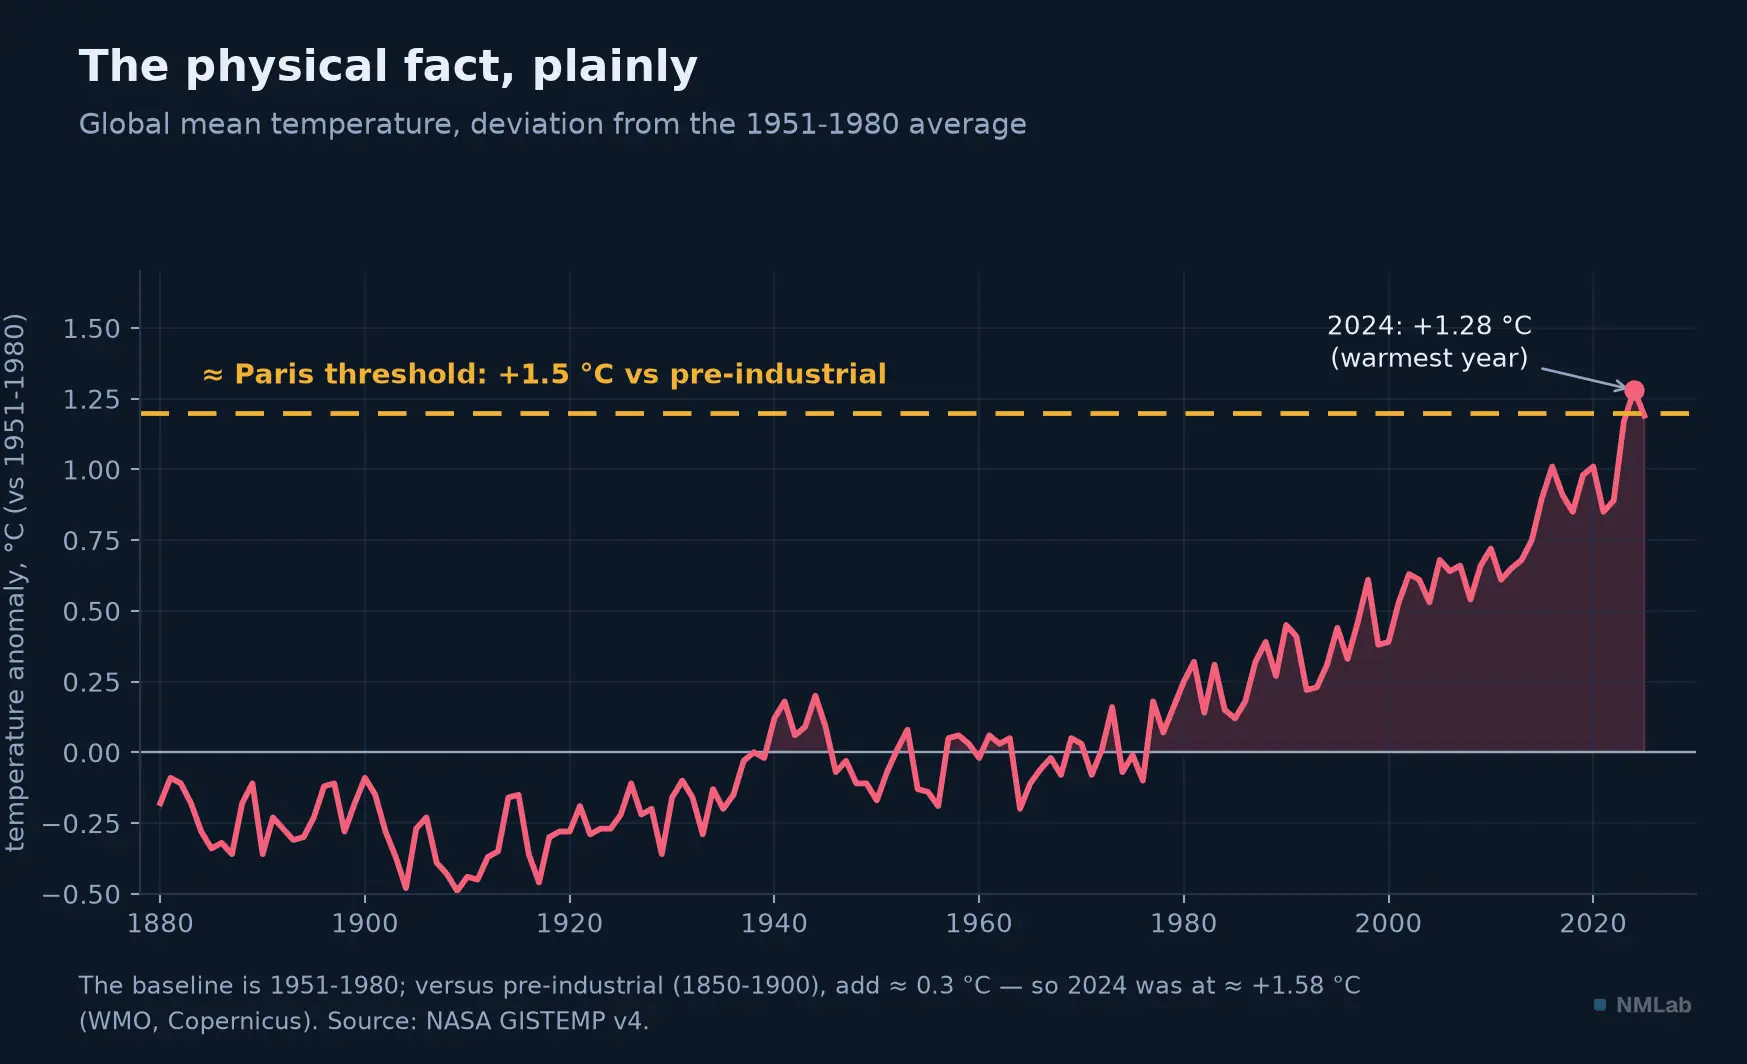
2024 was the warmest year ever measured, at +1.28 °C versus the 1951-1980 average. Mind the baseline: relative to pre-industrial, this anomaly approaches +1.58 °C — beyond the Paris Agreement's 1.5 °C threshold for that single year.
A methodological warning, because climate figures are a minefield of bad comparisons. The NASA data plotted in the figure are measured against the 1951-1980 average. But the famous "+1.5 °C" of the Paris Agreement is counted against pre-industrial (1850-1900), a period roughly 0.3 °C colder. The year 2024, at +1.28 °C on NASA's baseline, was therefore about +1.58 °C versus pre-industrial according to the World Meteorological Organization and Copernicus — the first calendar year above 1.5 °C. (The Paris threshold is judged over a roughly twenty-year average, not a single year; but the signal is unambiguous.)
This warming already has a bill, and it is climbing. Inflation-adjusted insured losses from natural catastrophes reached about $137 billion in 2024 — the fifth straight year above $100 billion, according to the Swiss Re Institute.
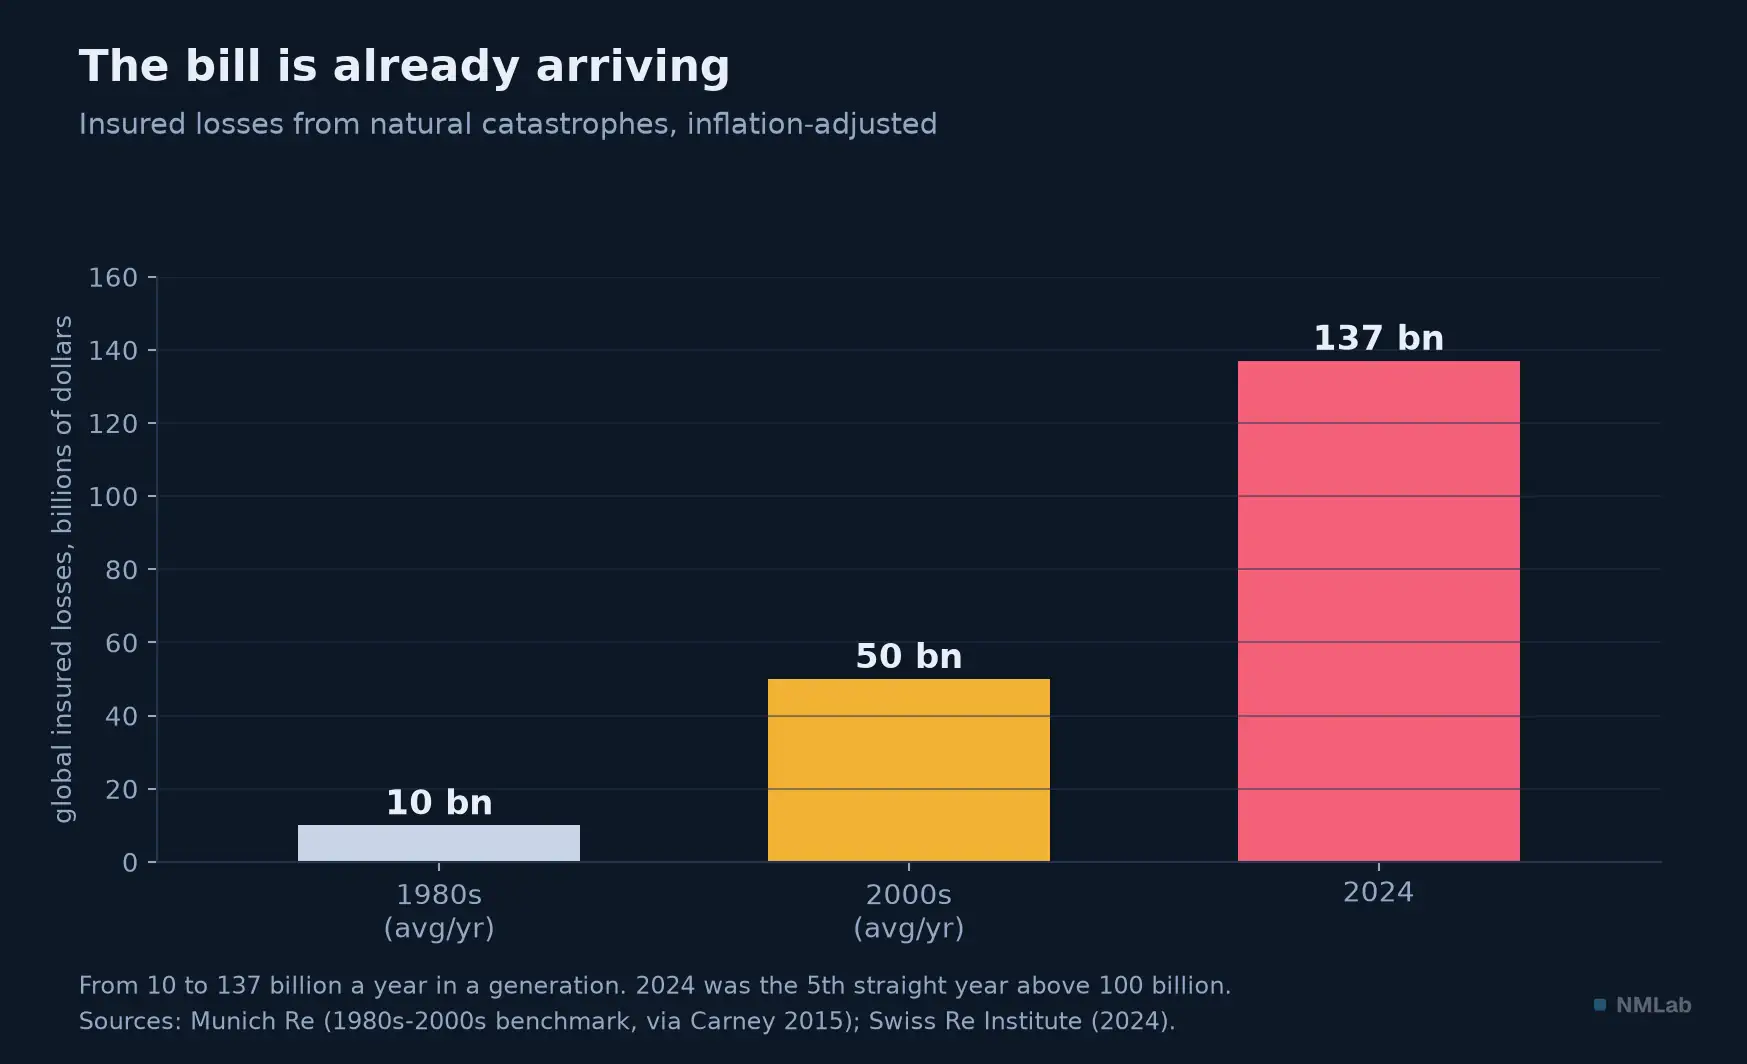
More than a tenfold rise in a generation. Carney already noted it in 2015: since the 1980s, the number of damaging climate events has tripled, and insured losses rose from about $10 to $50 billion a year. They have doubled again since.
State Farm's withdrawal is the logical consequence of this curve: when risk becomes too expensive to bear, the insurer leaves, and whole regions tip into the uninsurable. It is the first channel, the most concrete, through which climate enters an economy — not through a debate, but through a premium that climbs or a contract that isn't renewed.
How much does it cost, really? (And why no one knows)
Here rigor demands we slow down. On the fact of warming and its insurance bill, the data are solid. But the moment you ask "by how much will climate reduce world GDP?," you enter a swamp where the best minds divide by a factor of ten — and where extreme caution is in order. The reference tool is called a damage function: an equation linking the rise in temperature to the loss of output. The most famous of these models, DICE, earned its author William Nordhaus the Nobel Prize in Economics in 2018; in it, Nordhaus estimates damages at 2.1% of world income for +3 °C, and 8.5% for +6 °C, and derives a "social cost of carbon" of about $31 per ton of CO₂. A detail that should raise a flag: the trajectory his model deems economically optimal peaks at about 3.5 °C in 2100 — a world climatologists describe as deeply degraded, and well beyond the 1.5 to 2 °C of Paris. The economist's "optimum" and the climatologist's target are not in the same place.
This result depends decisively on two assumptions, and this is where the debate rages. The first is the discount rate — the price you put on the future. Nicholas Stern, in his famous 2006 review, used a very low rate; Nordhaus, a market-like rate of 4 to 4.5%. Yet Nordhaus himself showed it: with Stern's rate, the optimal carbon price is multiplied by ten and action becomes urgent; with his, it stays gradual. A technical parameter, invisible to the public, decides everything.
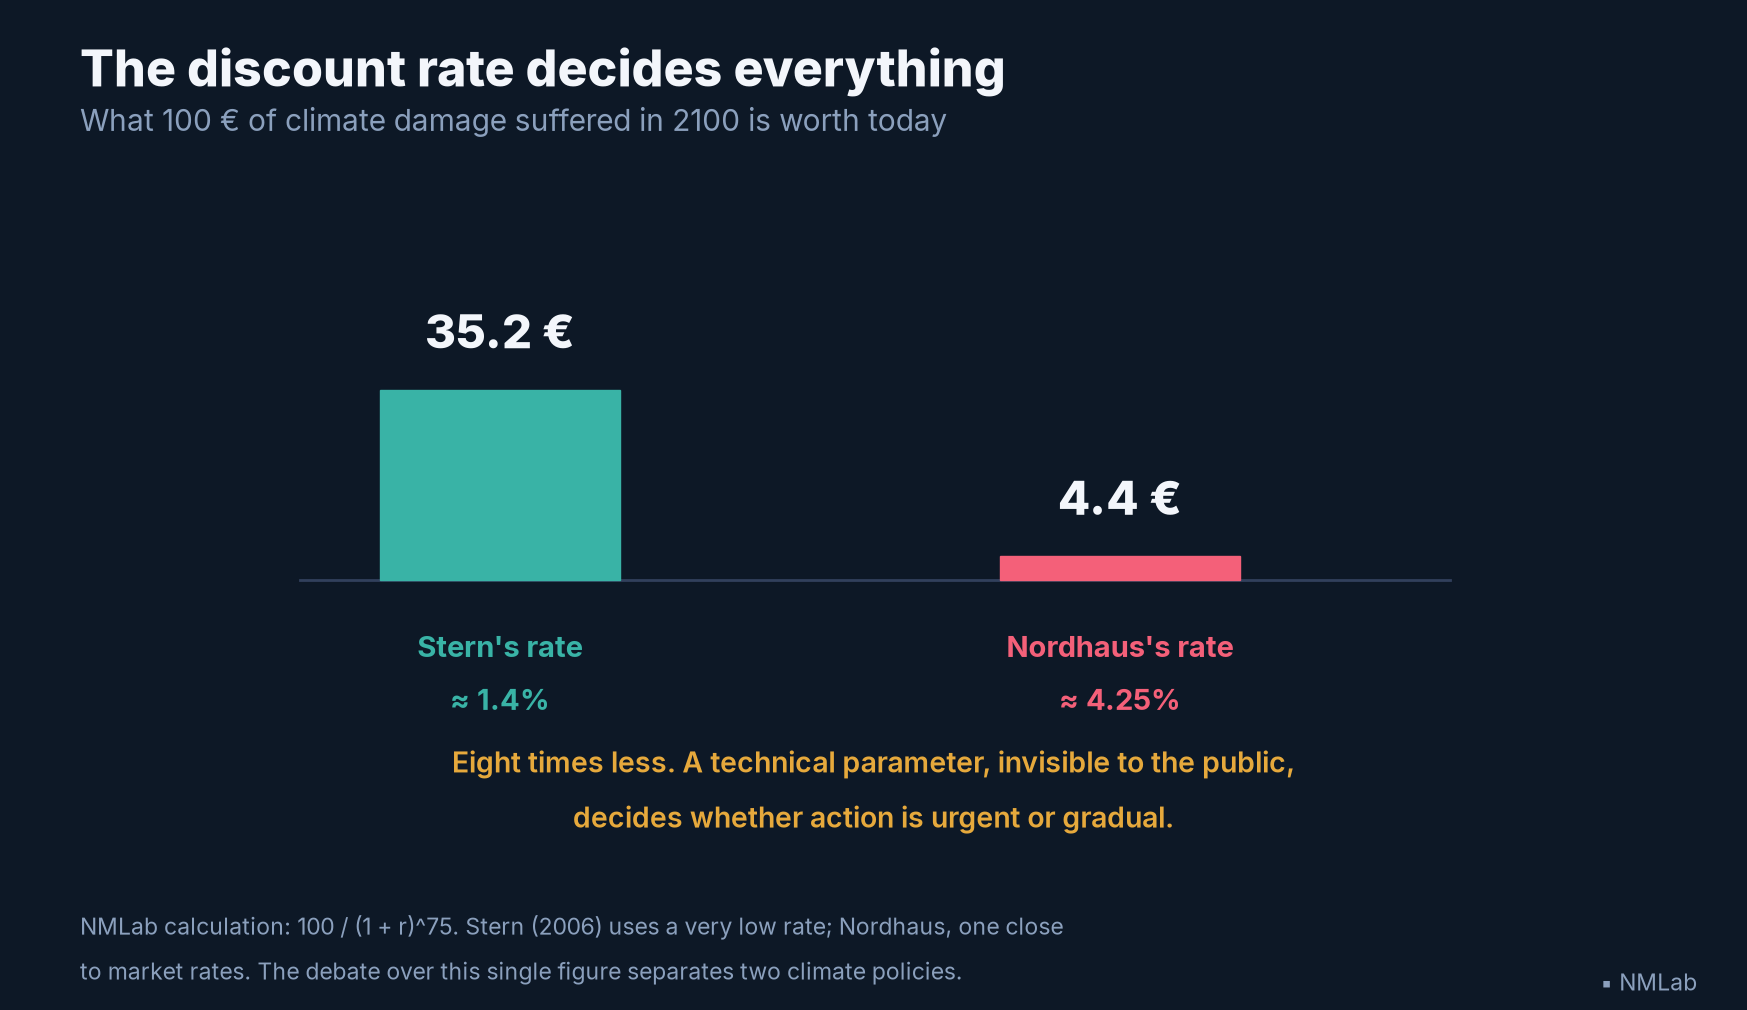
The same damage, future and certain, is worth eight times less under Nordhaus's rate than under Stern's. The whole disagreement about urgency sits in that gap.
The second assumption is the shape of the damage function beyond 3 °C — which Nordhaus himself calls a mere "placeholder," for want of data. His critics do not hold back: the economist Steve Keen faults him for assuming that 87% of GDP, because it happens "indoors," would be little affected; Simon Dietz and Nicholas Stern show that with the standard coefficients, it would take an implausible warming "on the order of 18 °C to reduce world output by half." And Robert Pindyck, of MIT, is blunt: these models "have crucial flaws that make them close to useless as tools for analysis" and "create a perception of knowledge and precision that is illusory."
Nothing illustrates this fragility better than an episode that occurred while this chapter was being written. In April 2024, a study published in Nature by Maximilian Kotz and co-authors went around the world: climate change would commit the world economy to an income reduction of 19% by 2049, that is $38 trillion of annual damage. The figure fueled countless articles. Yet there were two traps from the start: those 19% were a fall in level relative to a world without climate change, not an absolute contraction (the economy keeps growing); and the horizon was 2049, not 2100. But above all — and this is the fact to keep — that article was retracted by Nature in December 2025. The three authors themselves acknowledged that removing the erroneous data of a single country, Uzbekistan, changed the results so much that no correction would suffice — the anomalies had been documented a few months earlier in the same journal. The most-cited figure in the macroeconomics of climate collapsed on a database error. That is why these estimates must be handled with tongs, and why any single figure asserted with confidence should be distrusted.
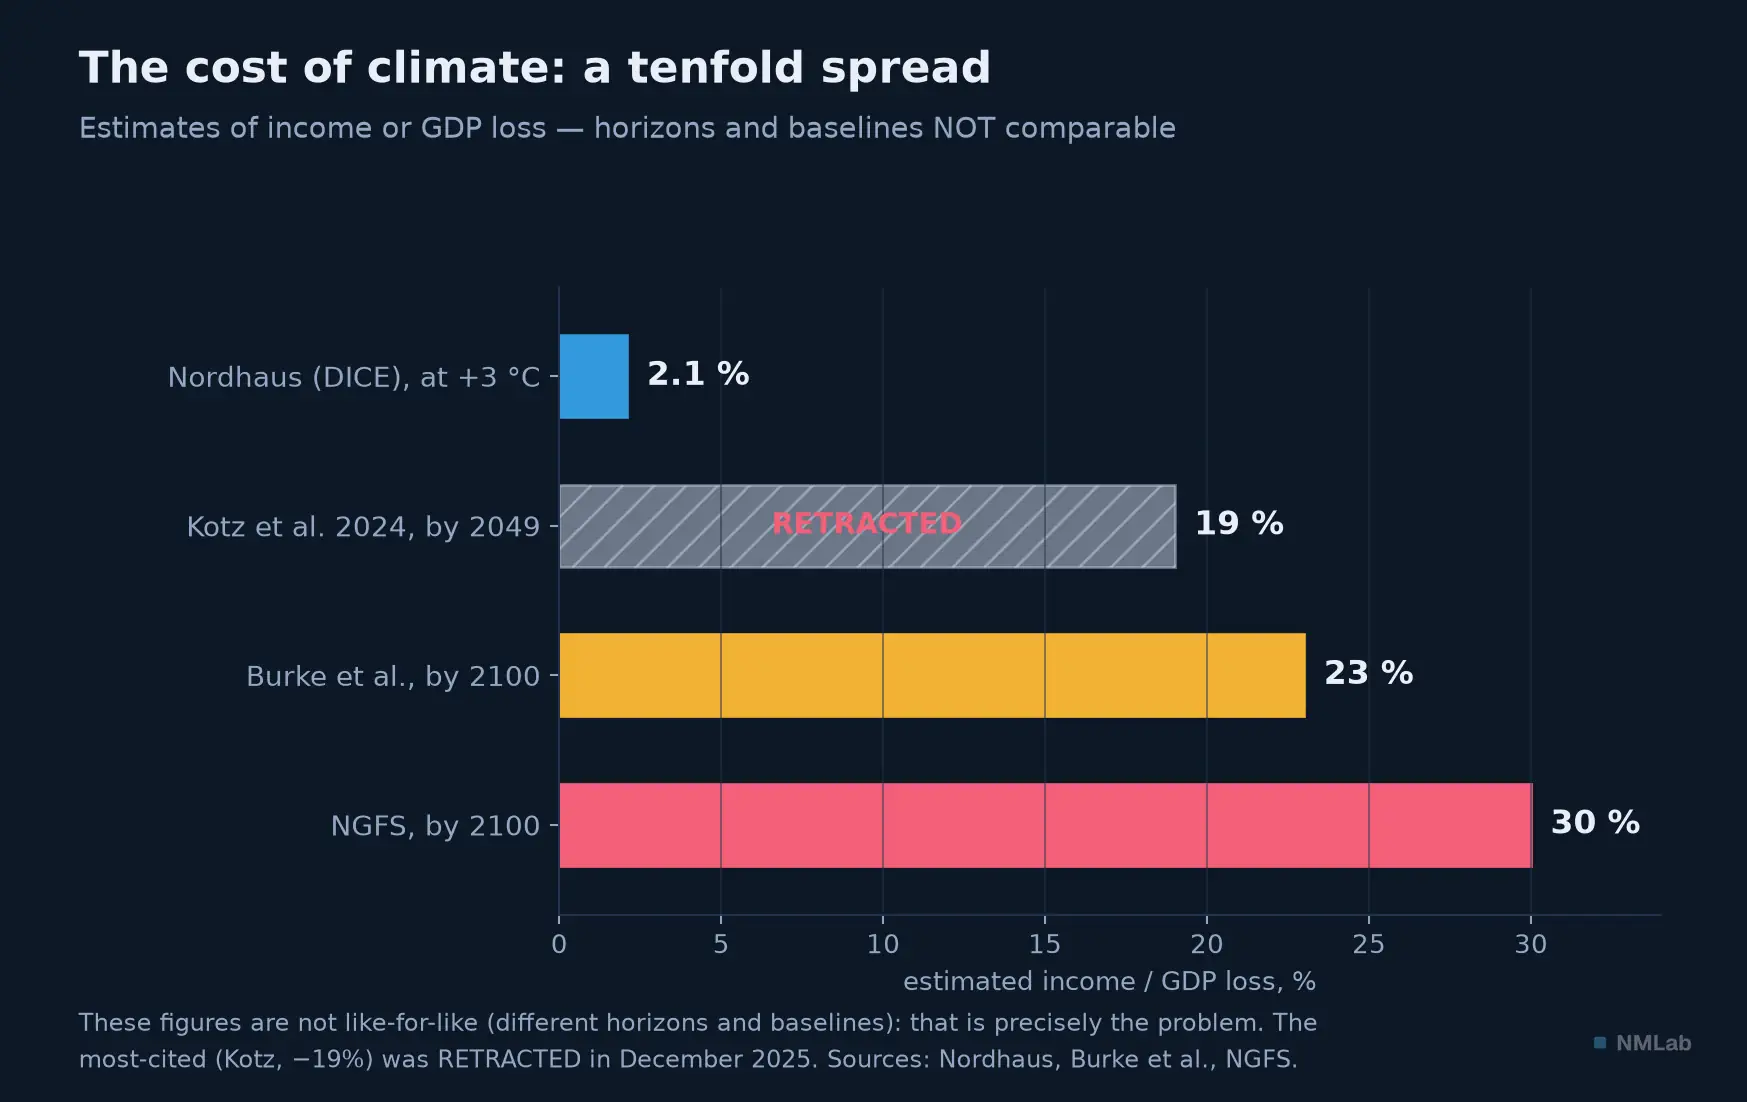
Figures that do not even compare like for like — different horizons and baselines. That is precisely the problem: anyone selling you a decimal is selling you wind.
What, then, is left standing? An order of magnitude, and a wide range. Non-retracted work — such as that of Marshall Burke, Solomon Hsiang and Edward Miguel (2015) — puts the loss of world income around 23% by 2100 under unchecked warming. The scenarios of the central banks' greening network (NGFS) go up to about 30% of GDP loss by 2100 in a world of unchanged policies. And the IPCC, cautious, refuses to advance a single number, judging even its own aggregate estimates probably underestimated, for want of being able to quantify tipping points. The honest truth fits in a sentence: the cost is real, probably large, but its magnitude remains uncertain by a factor of ten. Anyone selling you a decimal is selling you wind.
Inflation and stranded assets
Down from the century to the quarter: two channels, closer to the portfolio. The first is climate inflation. In March 2022, Isabel Schnabel, of the ECB's board, coined three words to describe it. Climateflation: the direct cost of disasters, which pushes prices up as harvests burn and supply chains break. Fossilflation: the price paid for our lingering dependence on fossil energy, responsible for most of the 2021-2022 inflation shock. And greenflation, more subtle: the transition itself, hungry for copper, lithium, cobalt, drives up the price of those metals. Climate is no longer an abstract long-term affair; it is already in the price index.
The second channel is transition risk made flesh: stranded assets. The reasoning, popularized by the think tank Carbon Tracker, is implacable. To keep a chance of staying under 2 °C, humanity can burn only a fraction of known fossil reserves — on the order of 20%. The rest is, literally, "unburnable carbon." Christophe McGlade and Paul Ekins quantified it in Nature in 2015: we must leave underground "a third of oil reserves, half of gas reserves and over 80% of coal reserves." Yet those reserves sit today, at full value, on the balance sheets of companies and the portfolios that hold them. The day the market takes this fact seriously, the loss of wealth could reach, according to the work of Jean-François Mercure and co-authors (2018), $1 to $4 trillion. A stranded asset is a reserve you paid for but will never be able to sell.
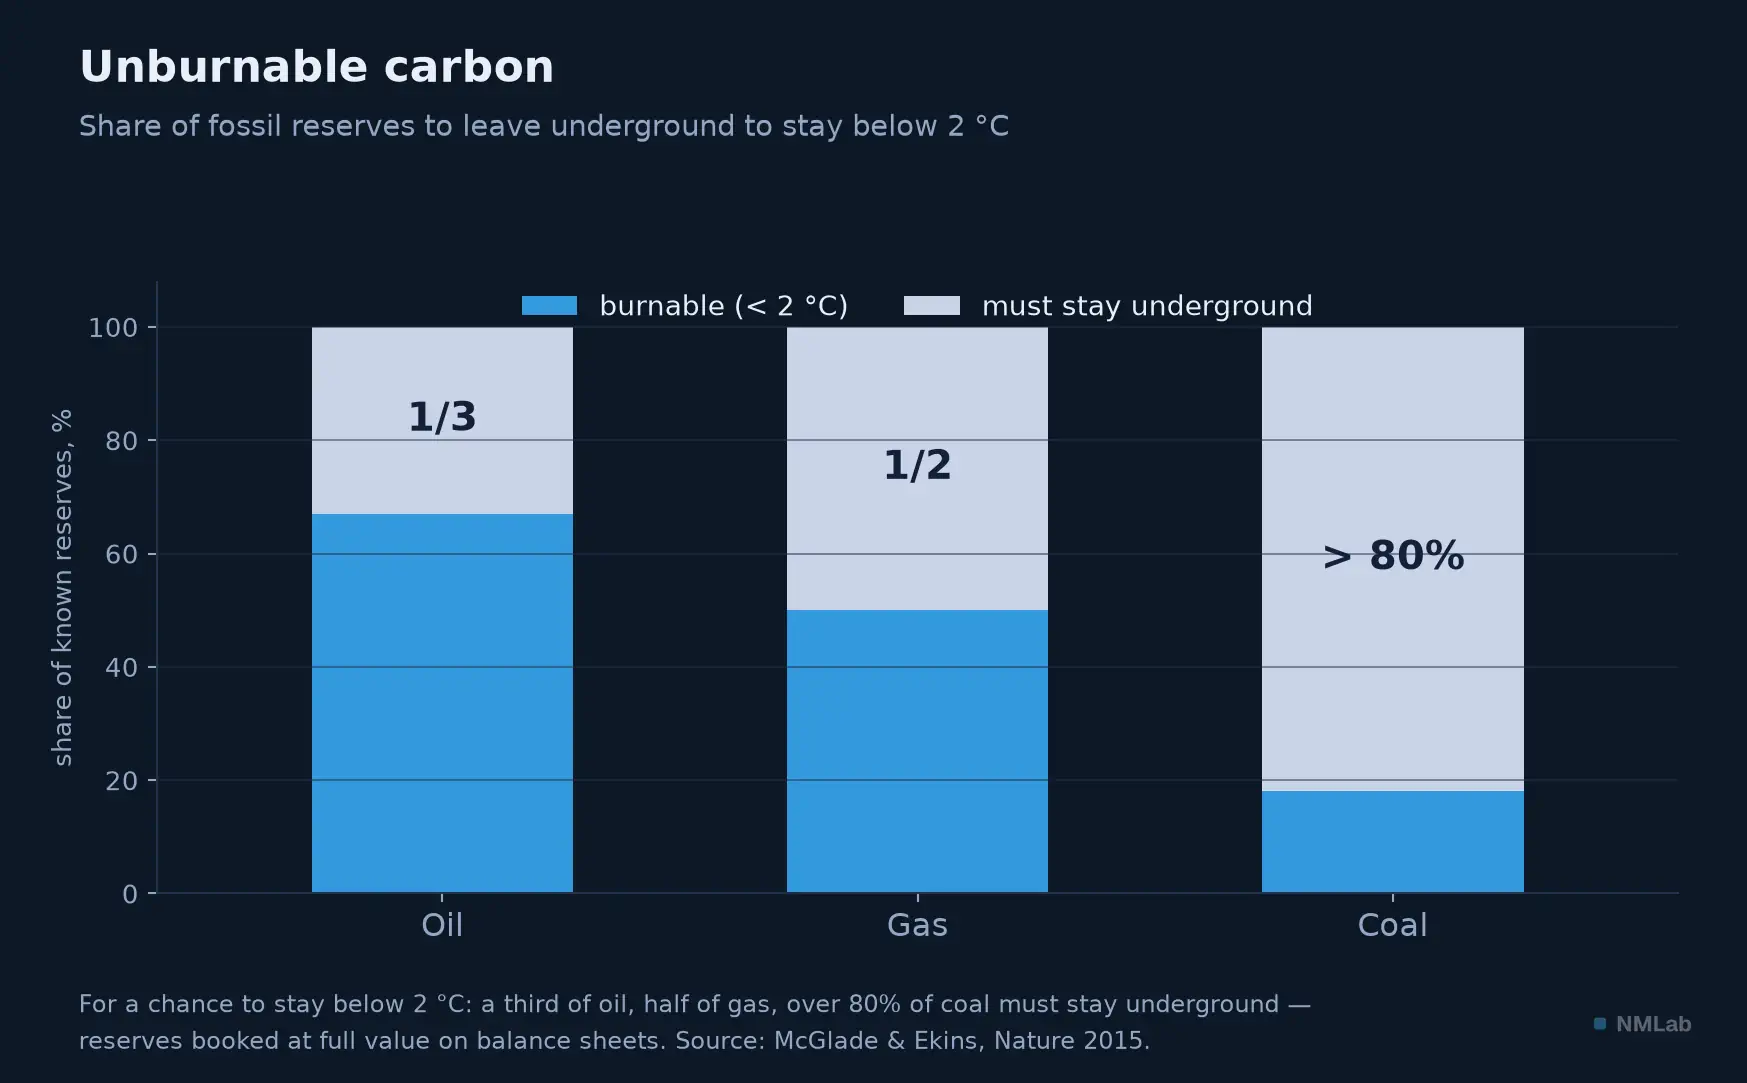
Those "unburnable" reserves nonetheless sit at full value on balance sheets. The day the market accounts for it, $1 to $4 trillion of wealth evaporates.
The transition is no longer costly — it's cheap
It would be dishonest, though, to paint only the risk. For the most important fact of the last decade, the one that changes everything, is good news — and it too runs against the conventional tale of a ruinous transition.
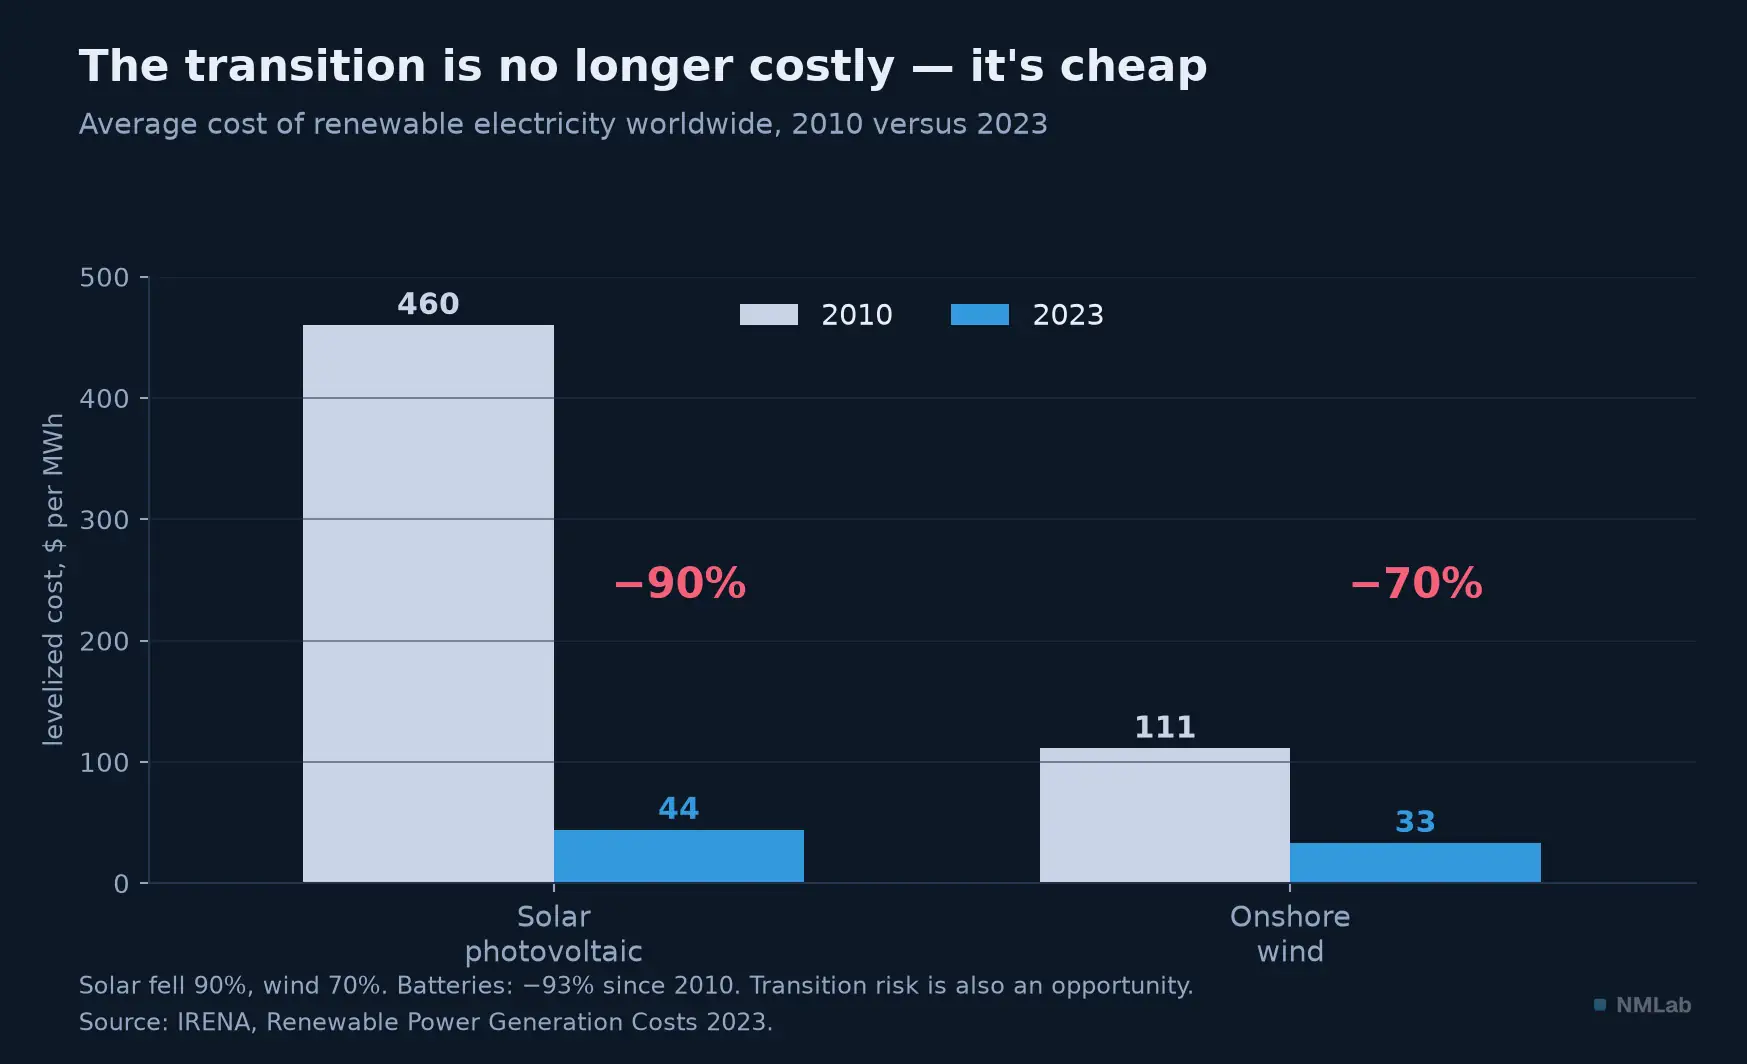
In thirteen years, the cost of solar fell by 90%, onshore wind by 70%, batteries by 93%. What was the most expensive way to generate power has become, across most of the world, the cheapest.
IRENA's figures are spectacular. The average cost of solar electricity went from 460 to $44 per megawatt-hour between 2010 and 2023 — a 90% drop. Onshore wind fell 70%, lithium-ion batteries 93% since 2010. These learning curves, regular as a Moore's Law, tipped the economics of energy: renewables, long subsidized because costly, are now in most regions the cheapest way to produce a kilowatt-hour. Transition risk has a forgotten twin: the transition opportunity. For every fossil asset that strands, a renewable capacity is built — and whoever financed it in time will have gained.
The channel that interests the macroeconomist: potential growth
That leaves the promise in the title to keep, and it is the least spectacular part — but the only one that ties climate to the rest of this module. Chapter 15 defined potential growth as the sum of what an economy gains in hands and what each hand produces. Climate acts on both, plus a third term, through three distinct channels that must not be conflated.
The capital stock, first. A disaster does not destroy a flow: it destroys factories, roads, housing — the accumulated capital on which potential output rests. Chapter 9 showed the accounting bias that follows: GDP records the rebuilding and never deducts the destruction, so a hurricane raises measured growth while impoverishing the country. The $137 billion of insured losses in 2024 are, moreover, only the covered part: total economic losses approach $320 billion. Nearly three fifths of the damage has no insurer: households, firms and states pay that "protection gap" out of their own pockets.
Labor, next, and this is the most underrated channel. Heat degrades the capacity to work, in agriculture and construction first. The International Labour Organization estimates that by 2030 heat stress will cost 2.2% of total working hours worldwide — the equivalent of 80 million full-time jobs. Set against the equation of chapter 14, that is a direct levy on the labor factor, and it does not fall evenly: it strikes hot, poor economies, the ones whose working-age population is still growing.
Productivity and the allocation of capital, finally. Adaptation — dikes, air conditioning, hardened networks — is a necessary investment that does not raise productive capacity: it protects it. Every euro that goes there does not go to the intangible that chapter 16 showed builds tomorrow's TFP. The transition, for its part, moves capital from one sector to another: costly right away, productive perhaps later.
How much, all told? Resist the temptation of a number: no central bank publishes a firm estimate of climate's effect on potential growth, and chapter 15 explains why — we already measure potential itself badly, its revisions being as large as itself. What exists are the NGFS scenarios, designed not to predict but to stress-test balance sheets against several worlds. The defensible formulation fits in one sentence: climate is the third factor slowly shifting an economy's cruising speed, after demography and productivity — with a certain sign, an unknown magnitude, and a very uneven distribution across countries.
What it changes for a portfolio
That leaves the investor's question, and it is subtler than it looks. How do you house a risk with a decades-long horizon in a market that lives quarter to quarter? That is, word for word, Carney's tragedy of the horizon. The honest answer is not a slogan. First, distrust the "ESG" label. Three researchers — Florian Berg, Julian Kölbel and Roberto Rigobon — showed, in a study with a telling title, Aggregate Confusion, that the ESG ratings of the major agencies are so divergent that their average correlation is only about 0.54: two agencies can rate the same company at opposite ends. "ESG" is therefore not a single, reliable quantity; it is a fuzzy aggregate, and that undermines every study claiming to measure its performance. Indeed, those performances are heterogeneous: after a golden age, sustainable funds saw record outflows — nearly $20 billion of net withdrawals in the United States in 2024. But beware the reverse misreading: ESG's underperformance in 2022-2023 is explained mostly by the rebound of fossil energy and defense after the invasion of Ukraine, and by rising rates — not by structural inferiority. The largest meta-analysis (New York University, more than a thousand studies) confirms it. On the investment side, about 59% of studies find comparable or superior performance; the benefit shows up mostly over long horizons, and when the market breaks.
The conclusion that follows the facts, without ceding to any camp, fits in three points. First, physical and transition risks are real, measurable and already at work, independently of any "green" label: temperature, insurance premiums, cost curves are facts, not opinions. Second, the quantified estimates of the macroeconomic cost are, by contrast, fragile and scattered — the 2025 retraction is the glaring proof; do not build a decision on a decimal. Third, with the transition now cheap, risk and opportunity are two faces of the same shift. The wise investor does not bet on a prophecy; he prepares his portfolio for a world where carbon will eventually have a price, where some reserves will never be sold, and where producing clean energy will cost less than burning it.
Key takeaways
- Three risks, not two — Carney (2015): physical (direct damage), transition (devalued assets) and liability (climate lawsuits) — the last almost always forgotten. "Once climate becomes a financial-stability issue, it may already be too late."
- The physical fact is solid — 2024: warmest year, ≈ +1.58 °C vs pre-industrial (first year above 1.5 °C). Insured losses: $137bn in 2024, 5th straight year above $100bn (Swiss Re). Insurers are withdrawing (State Farm, California).
- The macro cost is uncertain by a factor of ten — Damage functions (Nordhaus, DICE) give an "optimum" at ~3.5 °C, already beyond Paris, and depend crucially on the discount rate (the Stern-Nordhaus debate). ⚠️ The famous "−19% of world income by 2049" (Kotz et al., Nature 2024) was retracted in December 2025: distrust any single figure.
- Climate is already in prices — Climateflation, fossilflation, greenflation (Schnabel, ECB, 2022). Stranded assets: only ~20% of fossil reserves are "burnable" (Carbon Tracker); $1 to $4 trillion of wealth at risk (Mercure et al.).
- The transition is cheap — Solar −90%, wind −70%, batteries −93% since 2010 (IRENA). Transition risk has a twin: opportunity.
- The macro channel — Climate shifts potential growth three ways: capital destroyed ($137bn insured in 2024, ~$320bn of total losses); labor prevented (2.2% of world working hours lost to heat stress by 2030, ILO); investment diverted to adaptation, which protects capacity without raising it. Certain sign, unknown magnitude — no central bank puts a firm number on it.
- For the investor — "ESG" is not a reliable measure (ratings correlate ≈ 0.54, Aggregate Confusion). Its 2022-2023 underperformance owes to the fossil rally and rates, not to a structural flaw. The risks, though, are real whatever the label.
The journey ahead
Since chapter 9, you have piled up the concepts: GDP, real growth, productivity, demography, saving, the output gap, climate. It is time to get your hands dirty. For all the figures we have discussed — the saving rate, the output gap, the temperature anomaly, the cost of carbon — do not live in textbooks: they live in databases you can consult yourself, for free, in a few clicks. The next chapter is a workshop: "Data Workshop: Discovering FRED", the formidable warehouse of the Federal Reserve Bank of St. Louis. Until then, an exercise: find out whether your region has, in the last five years, seen insurers withdraw or premiums spike. You will then know, better than through any model, how fast climate risk turns into a price.
Sources and references
- Mark Carney, "Breaking the Tragedy of the Horizon – climate change and financial stability", Bank of England, Lloyd's of London, September 29, 2015 — the three risks (physical, liability, transition) and the "tragedy of the horizon."
- William D. Nordhaus, "Revisiting the Social Cost of Carbon", PNAS 114(7), 2017 (damages of 2.1% at +3 °C, 8.5% at +6 °C; social cost ≈ $31/tCO₂); and "Projections and Uncertainties…," American Economic Journal: Economic Policy 10(3), 2018 (cost-benefit optimum ≈ 3.5 °C in 2100). Nobel Prize in Economics 2018.
- Nicholas Stern, The Economics of Climate Change: The Stern Review, 2006; W. D. Nordhaus, "A Review of the Stern Review," Journal of Economic Literature 45(3), 2007 — the decisive debate over the discount rate.
- Steve Keen, "The appallingly bad neoclassical economics of climate change," Globalizations 18(7), 2021; Simon Dietz & Nicholas Stern, Economic Journal 125(583), 2015 ("~18 °C to reduce output by half"); Robert S. Pindyck, "The Use and Misuse of Models for Climate Policy", Review of Environmental Economics and Policy 11(1), 2017 (models "close to useless").
- Maximilian Kotz, Anders Levermann & Leonie Wenz, "The economic commitment of climate change", Nature 628, April 17, 2024 — article RETRACTED. See the retraction notice: "Retraction Note: The economic commitment of climate change", Nature 648, December 2025; and the anomalies that prompted it (Uzbekistan data), documented in "Data anomalies and the economic commitment of climate change", Nature, 2025. The "−19% of income by 2049" must not be presented as an established fact.
- Marshall Burke, Solomon Hsiang & Edward Miguel, "Global non-linear effect of temperature on economic production", Nature 527, 2015 (≈ −23% of world income by 2100); NGFS, Phase V climate scenarios, November 2024 (up to ~30% of GDP loss by 2100); IPCC, AR6 WGII, 2022 (refusal of a single number, estimates probably underestimated).
- Swiss Re Institute, sigma — insured losses ≈ $137bn in 2024, 5th straight year above $100bn; Munich Re (via Carney 2015) — tripling of events and rise in losses from ≈ $10 to $50bn/yr since the 1980s. State Farm General (California): halt of new policies (May 2023), non-renewal of ≈ 72,000 contracts (March 2024).
- International Labour Organization, Working on a Warmer Planet: The Impact of Heat Stress on Labour Productivity and Decent Work, 2019 — 2.2% of total working hours worldwide lost to heat stress by 2030, the equivalent of 80 million full-time jobs.
- Isabel Schnabel (ECB), "A new age of energy inflation: climateflation, fossilflation and greenflation," March 17, 2022.
- Carbon Tracker, Unburnable Carbon (2011-2013); Christophe McGlade & Paul Ekins, Nature 517, 2015 ("a third of oil, half of gas, over 80% of coal" to leave underground); Jean-François Mercure et al., Nature Climate Change 8, 2018 ($1 to $4 trillion of stranded assets).
- International Renewable Energy Agency (IRENA), Renewable Power Generation Costs in 2023 — solar −90%, onshore wind −70%, batteries −93% since 2010.
- Florian Berg, Julian F. Kölbel & Roberto Rigobon, "Aggregate Confusion: The Divergence of ESG Ratings", Review of Finance 26, 2022 (average correlation ≈ 0.54); Whelan et al. (NYU Stern, 2021, meta-analysis of 1,141 studies). Flow data: Morningstar (≈ −$20bn of U.S. sustainable-fund outflows in 2024).
- Figure data: NASA GISTEMP v4 (temperature anomaly); Swiss Re / Munich Re (insured losses); IRENA (renewable costs); McGlade & Ekins (2015) and Nordhaus, Burke et al., NGFS for the cost estimates — vintage of July 16, 2026.