14. Demography and Growth: How Population Shapes the Economy
· Updated on · 18 min read
Tokyo, March 1995. Japan's Statistics Bureau records a number nobody notices: the working-age population has just reached 87 million. It is a peak. It will never see it again.
Nothing happens. The country does not collapse, the factories run, the stock market has already fallen back from its delirium but the economy works. It will take thirteen more years — until 2008 — for the total population to peak in turn, and it is that second peak the newspapers will comment on. The first, the only one that really mattered for production, had gone unnoticed.
Thirty years on, the tally is in: Japan has 73.3 million people of working age. One working-age adult in six has vanished — down 15.7%. No war, no epidemic, no exodus: just demography, which advances at the speed of a clock hand and which nobody ever sees move.
For those thirty years, the whole world explained that Japan was "stagnating." This chapter will show you that this was largely false — and that demography is the one macroeconomic factor whose next thirty years are, in the main, already known today.
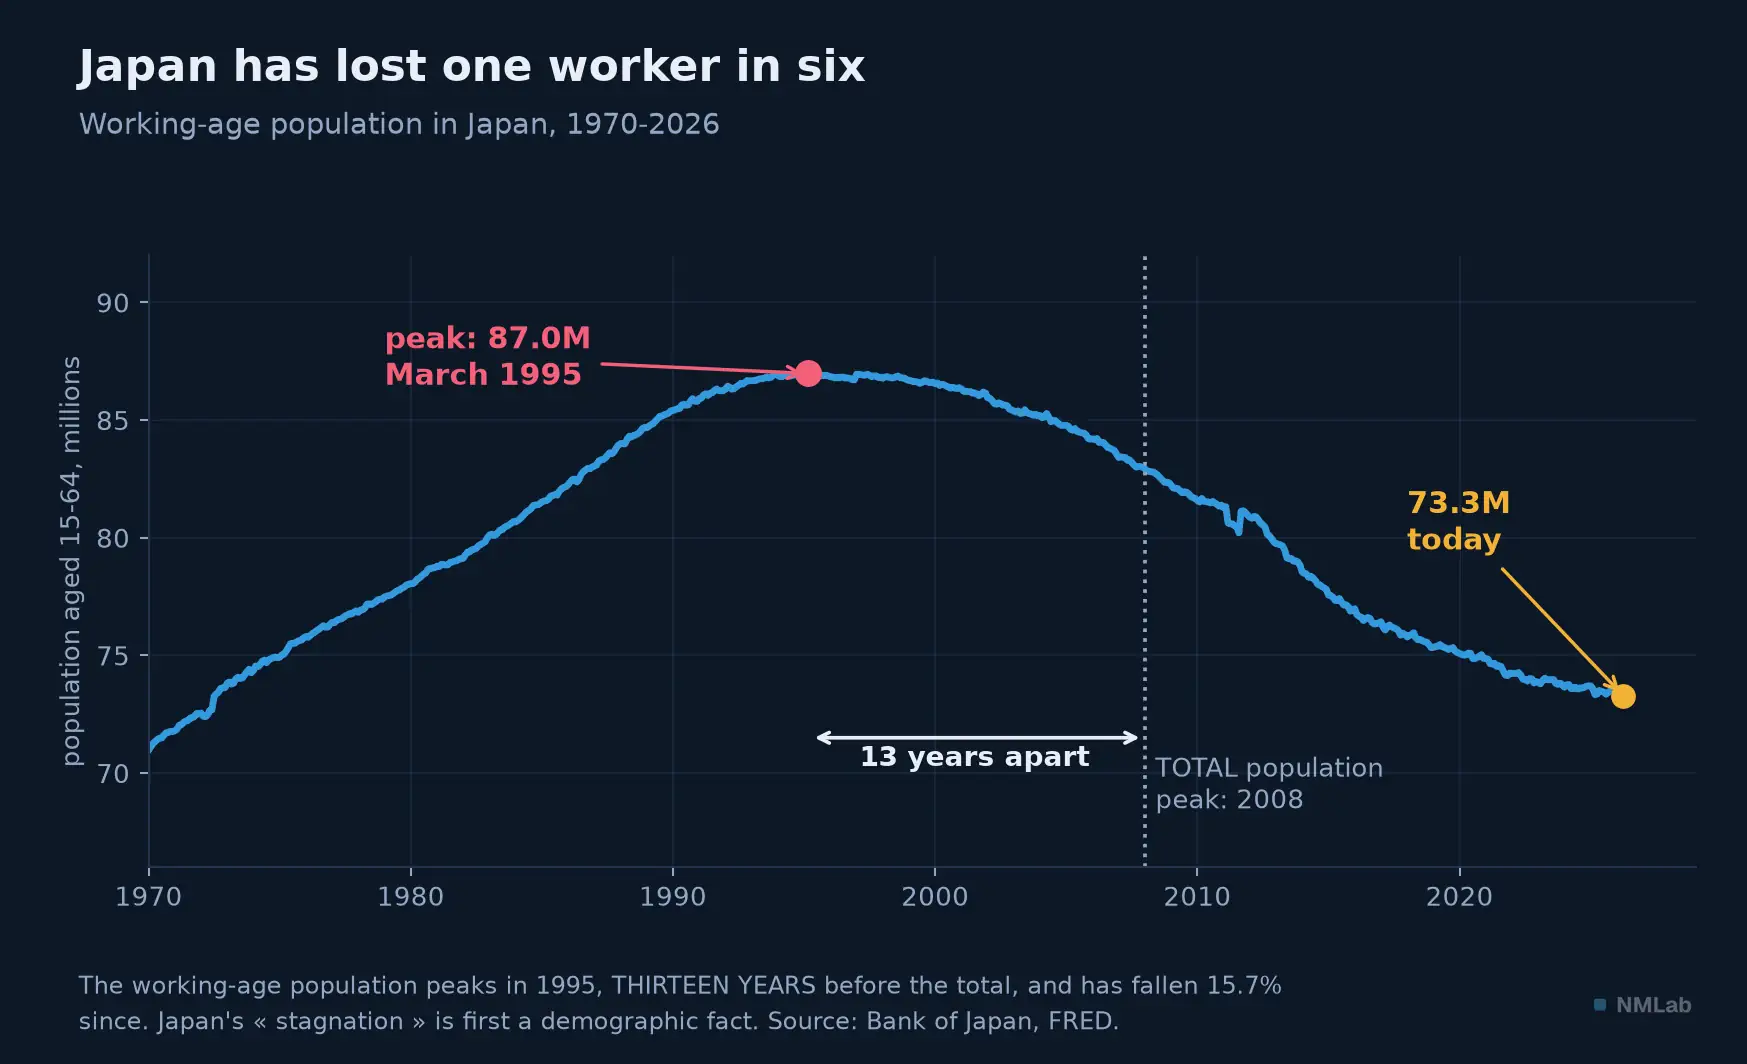
The working-age population peaks thirteen years before the total population. It is the first peak that counts for output.

At a glance — Level: Intermediate · Prerequisites: chapter 12
By the end of this chapter, you will be able to:
- read the one growth equation whose first term is known thirty years in advance;
- explain why Japan did not stagnate but shrank — and what the denominator changes;
- see why the demographic dividend is never automatic.
The passages marked "the detail" line up the compared figures; the conclusions hold without them.
The simplest equation in macroeconomics
An economy does not produce by magic. It produces because people work, and because every hour worked produces something. It all fits into an identity you could write on a subway ticket:
GDP growth ≈ working-age population growth + productivity growth.
This is not a theory, it is an accounting decomposition. One qualification matters, though: the equality is exact if productivity is measured per worker. Chapter 12 defined it per hour — and between the two sits a third term, hours worked: GDP growth ≈ working-age population + hours per worker + output per hour. Japan is the very illustration of this, its annual hours worked having fallen markedly over the period. The term is small enough and slow enough to be dropped in broad-brush reasoning, real enough to rule out the word "exact." Chapter 12 dealt with the productivity term. Here is the first, and it has a property the second does not: it is almost entirely known in advance. The workers of 2050 are already born. Thirty-year demographic forecasts do get things wrong, but by a margin that bears no comparison with productivity forecasts — and nobody, in 1995, should have been surprised by the Japan of 2025.
That is what makes this chapter unusual: for once, macroeconomics is talking about a future it can see coming.
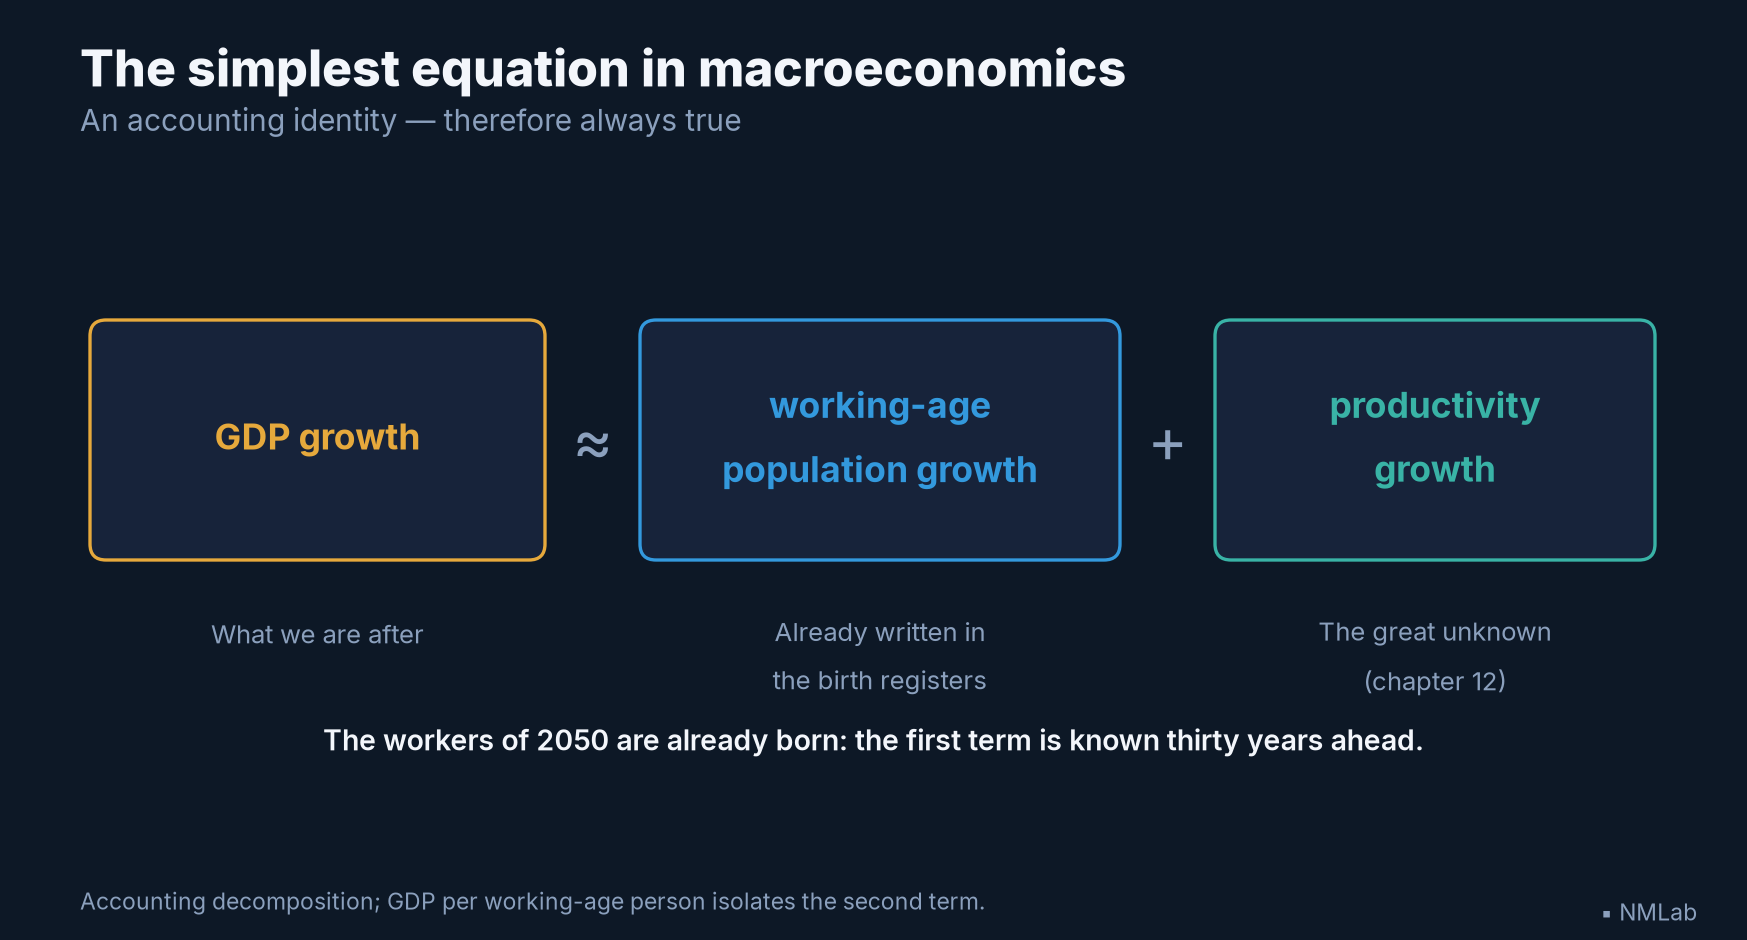
Two terms, two natures: one is already written in the birth registers, the other remains chapter 12's great unknown.
Japan did not stagnate: it shrank
Take the Japanese case again, with the right denominator. One study settled the question, signed by Jesús Fernández-Villaverde, Gustavo Ventura and Wen Yao, under a title that says it all: The Wealth of Working Nations. Their table, running from 1991 to 2019, deserves a line-by-line stop.
The detail, line by line — Total GDP growth: Japan 0.83% a year, the United States 2.58%. A gap of 1.75 points. That is the number that fed thirty years of commentary on the "lost decade" — which runs to three.
GDP growth per capita: Japan 0.76%, the United States 1.63%. The gap is already narrowing.
GDP growth per working-age person: Japan 1.39%, the United States 1.65%. A gap of 0.26 points. The authors put it without detour: "Suddenly, there is nothing enigmatic about Japan's GDP growth. It is the consequence of an annual decline in working-age adults by about 0.54%."
And the result that clinches the demonstration: from 1998 to 2019, Japan grew slightly faster than the United States per working-age adult — 31.9% cumulative against 29.5%. Better still: from 2008 to 2019, Japan posts the best performance in the G7 on that measure, at 1.49% a year.
The corollary is savage for a debate that occupied central banks for twenty years. The authors note it: criticizing Japanese monetary policy after 1998 for failing to deliver faster output growth per capita "overlooks the fact that monetary policy has little influence over demographic trends." Japan having done better than the United States per working-age adult, "it is hard to pinpoint what more the Bank of Japan could have achieved."
One caveat, and an important one: this result is bounded to 1991-2019. Extend the same series to 2024 and the gap reopens sharply — the United States accelerates after the pandemic, Japan does not. The thesis holds for its window, not for eternity.
The general lesson, though, does not budge: a flat total GDP in a country losing its working-age adults is not a failure of economic policy. It is arithmetic.
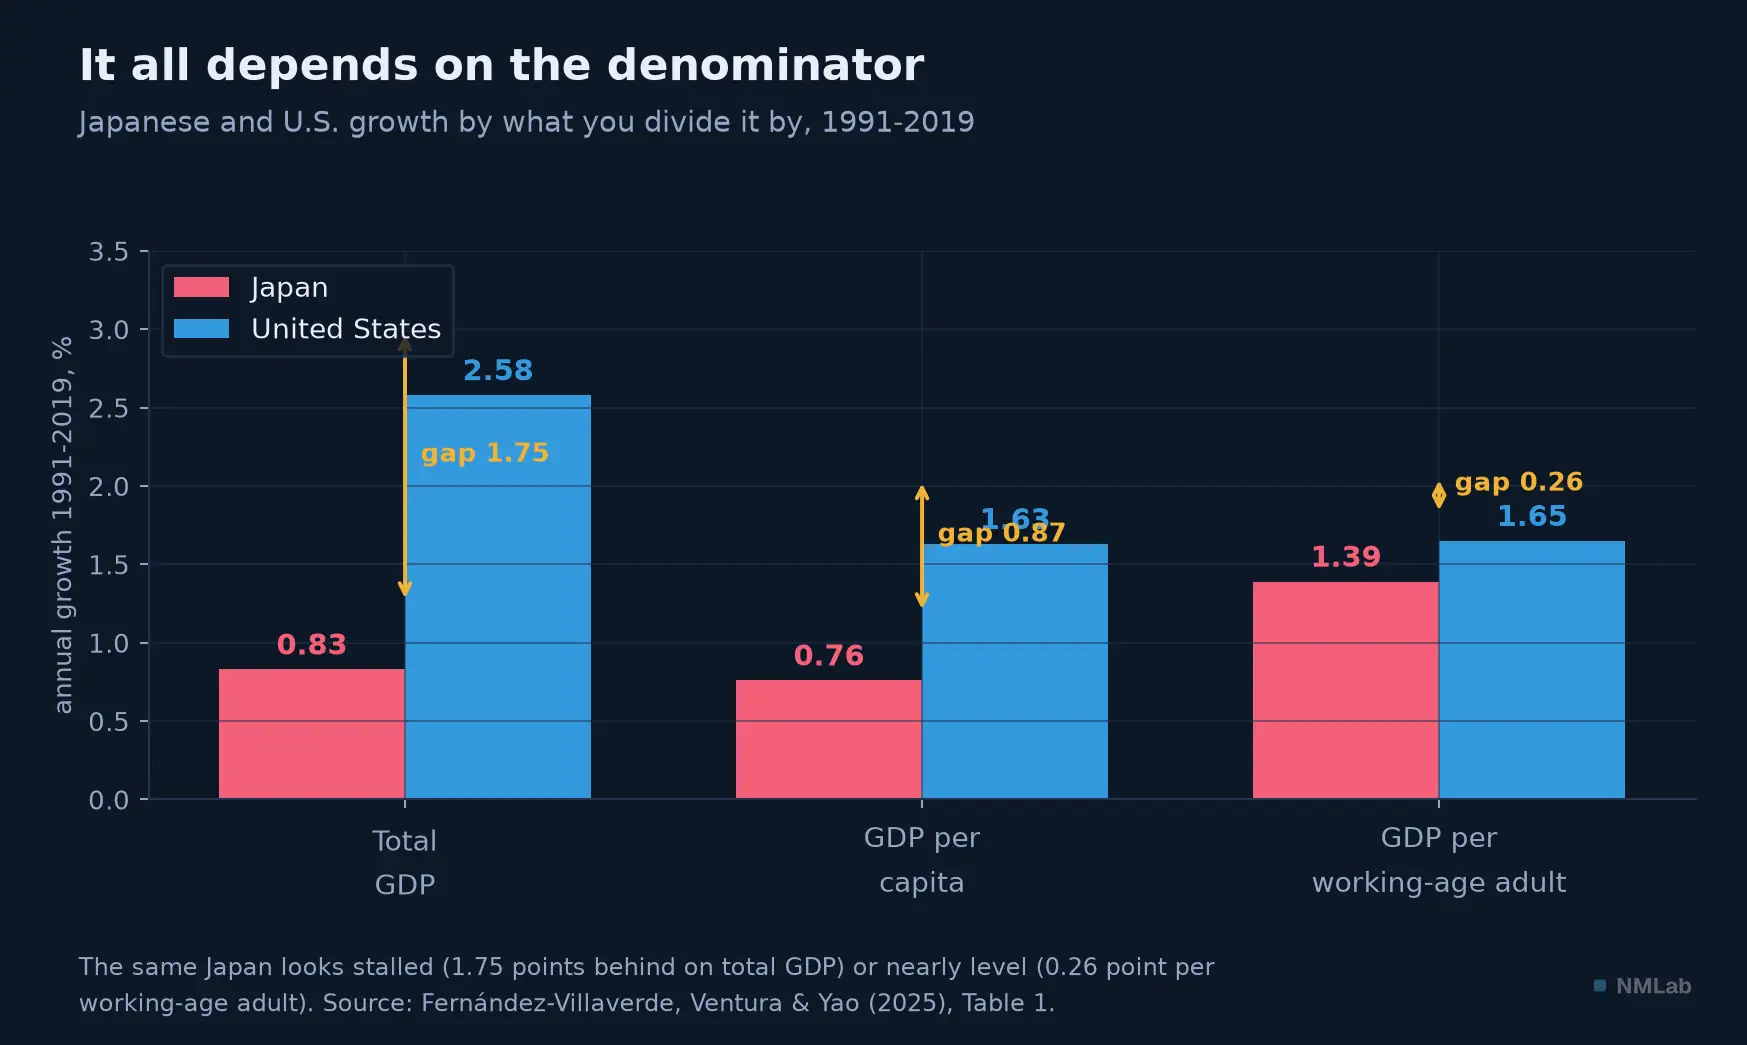
The same Japan looks stalled, or very nearly level, depending on whether its output is set against its population or against its working-age adults.
It is not the level that counts, it is the speed
A legitimate objection, at this stage: Japan is an extreme case, and Europe is not Japan. It is right on the first count and wrong on the second — but not for the reason you would think.
Japan did not age early. In 1950, France already counted 11.4% of people aged 65 and over, Sweden 10.2%; Japan did not cross 10% until 1985. It arrived last. What sets it apart is not the moment of departure: it is the speed.
Japan's Cabinet Office produced the comparison that hurts, and the calculation on World Bank data confirms it. Going from 7% to 14% of the population aged 65 and over took 115 years in France, 85 in Sweden, 47 in the United Kingdom, 40 in Germany. In Japan: 24 years, from 1970 to 1994. The same road, five times faster.
Except that this needs correcting straight away, and the correction is instructive about how numbers age. That document dates from 2003, and it concluded that Japan had aged faster than any other country. That is no longer true. The same calculation gives, for South Korea: 18 years, from 2000 to 2018. Japan's record has been beaten by a country that had not yet begun when the document was written — and the OECD projects that Korea's dependency ratio will overtake Japan's by 2050.
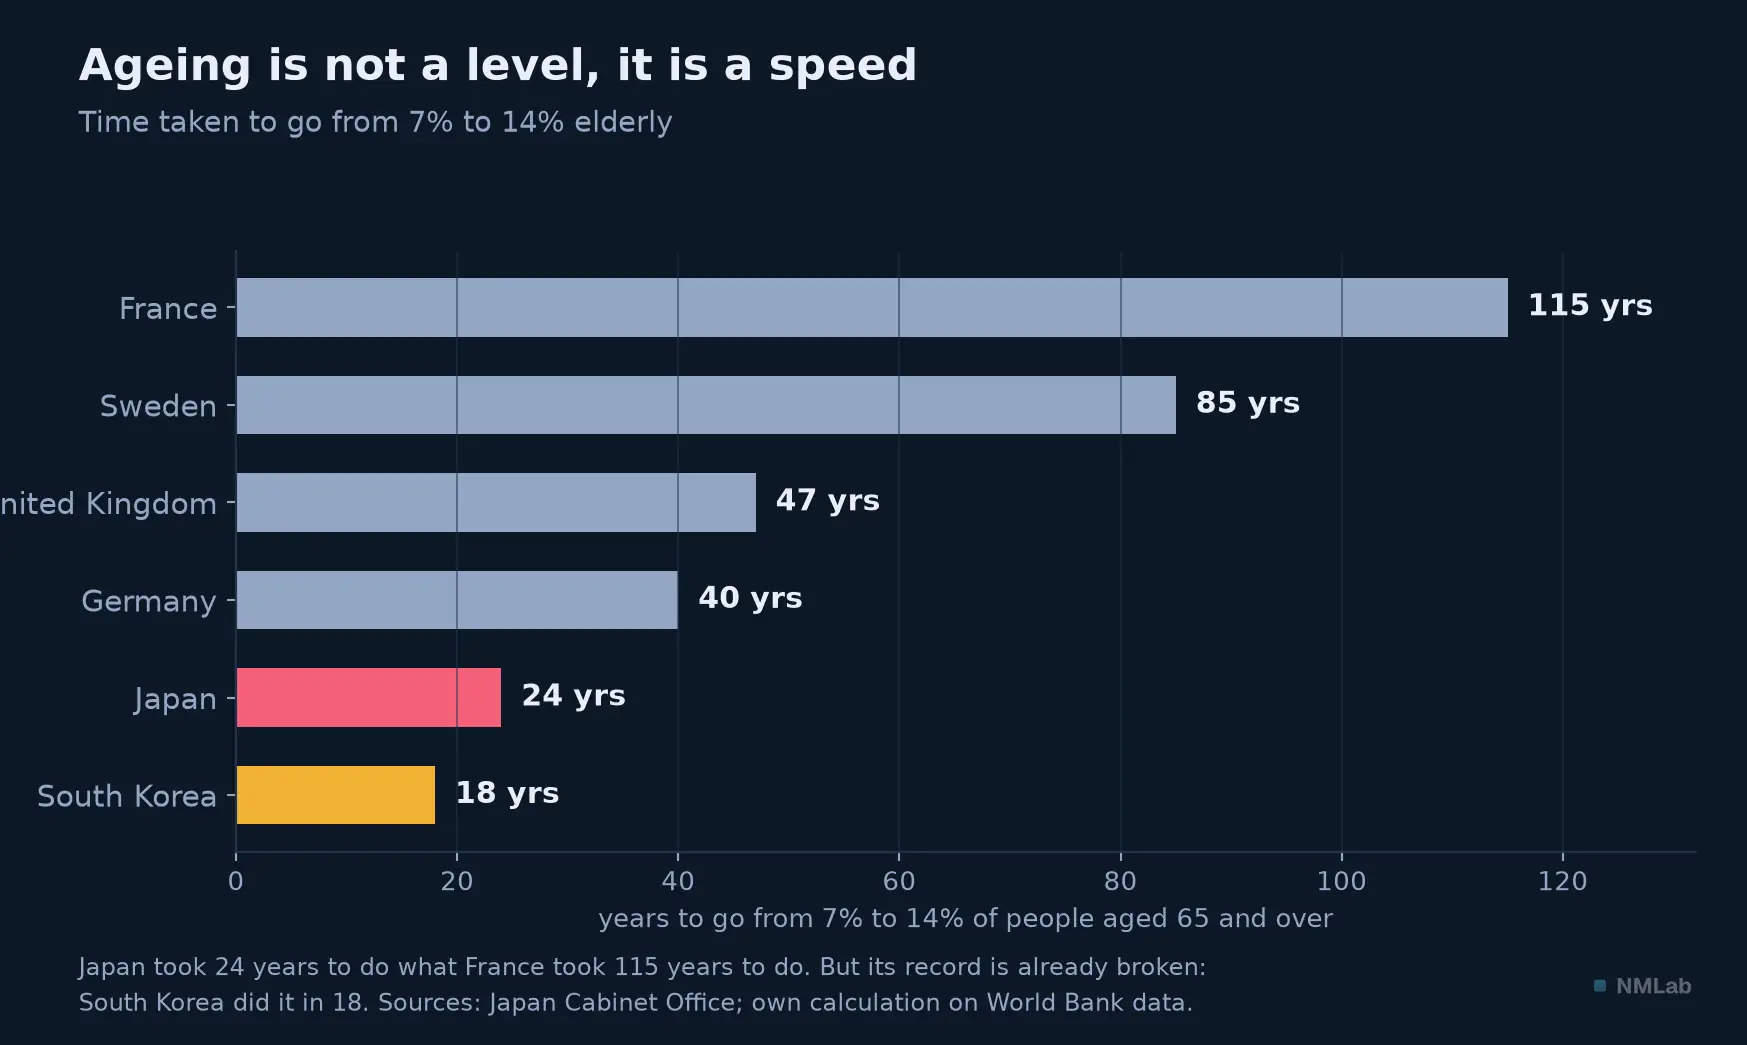
The same demographic road, covered five times faster — and already outdone by South Korea.
For it is indeed that ratio which translates ageing into an economic constraint: the number of people aged 65 and over set against those of working age. In Japan it stood at 17.3% in 1990. It stands at 49.2% in 2024. It has tripled in thirty-five years: the country has gone from about six working-age adults per senior to two. And the OECD projects 79% in 2050 — that is, 1.3 working-age adults per retiree.
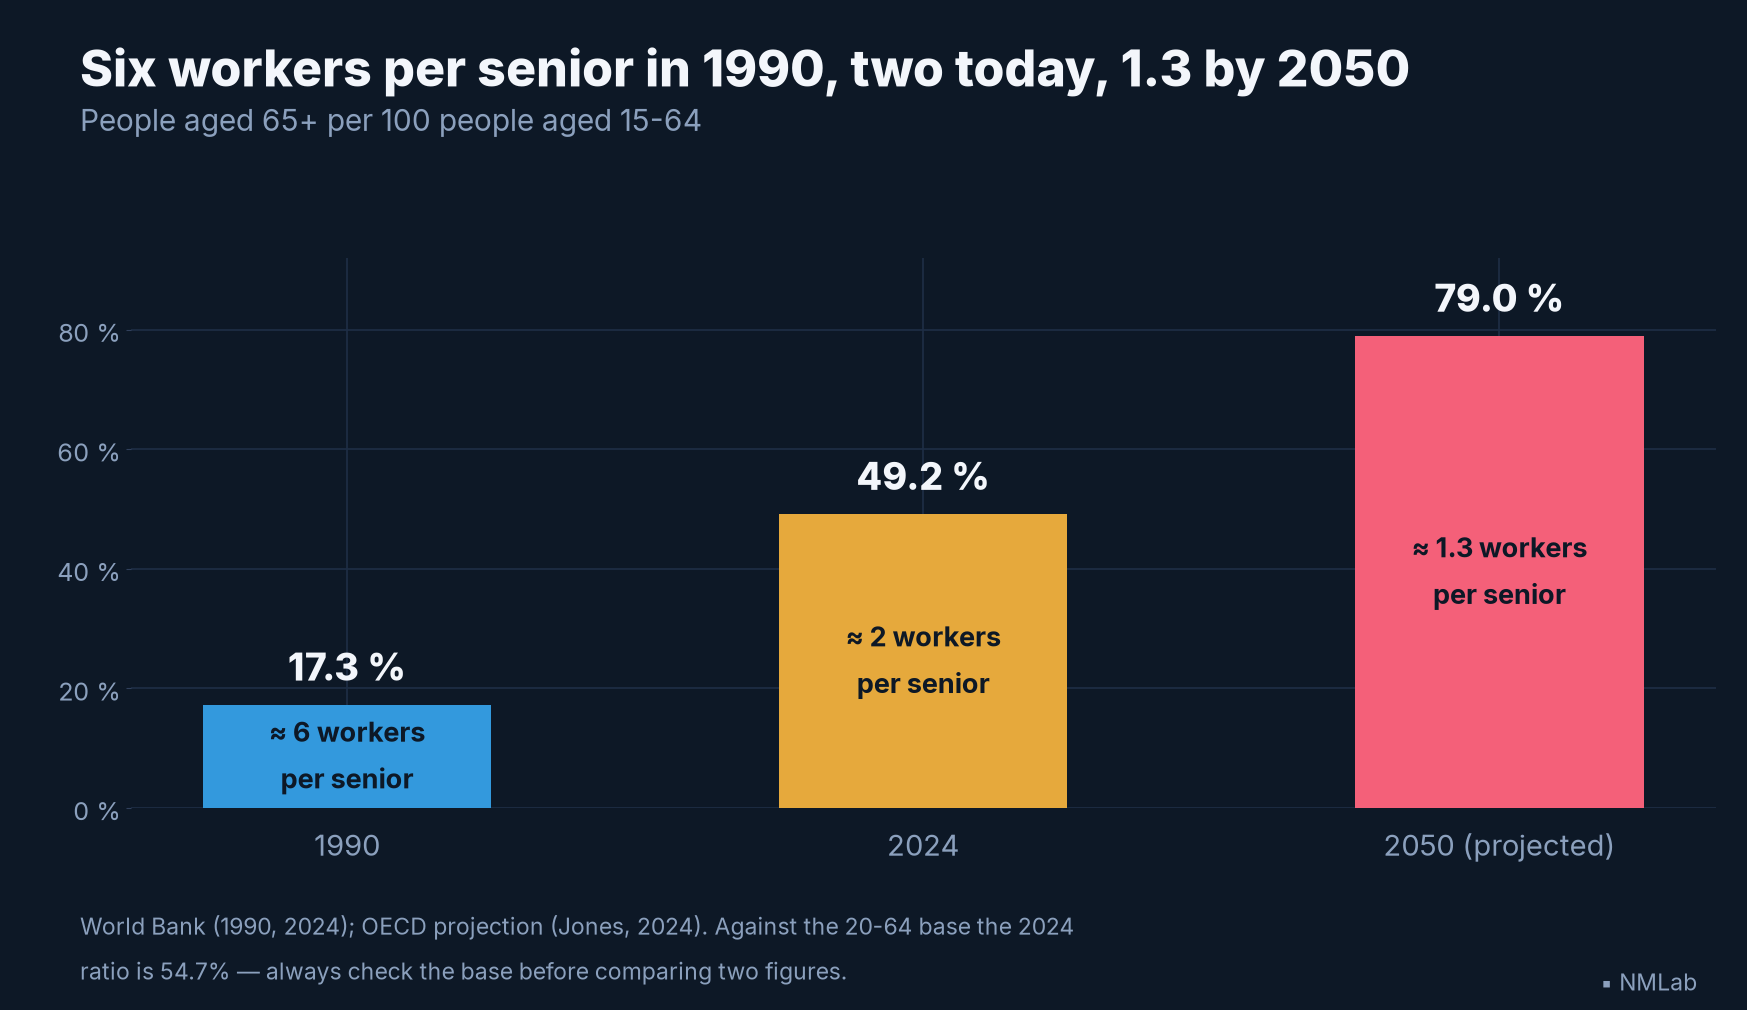
Thirty-five years to go from six workers per senior to two; twenty-six more to fall to 1.3. Nothing in this curve depends on a policy decision.
A word of warning, because it traps everyone: this ratio depends entirely on its definition. Set against the 15-64s, it gives 49%; set against the 20-64s, as the OECD does, it gives 54.7%. Narrower base, higher ratio — mechanically. Seeing the two numbers cohabit in the same article is the sign that nobody is telling you which is which.
Is Japan, for all that, "the oldest country in the world," as one reads everywhere? Almost: it is second, with 29.9% aged 65 and over, behind Monaco and its 36%. But Monaco has thirty-eight thousand inhabitants. Among countries of more than forty million people, Japan is first — and by a distance: 29.9% against 24.9% for Italy, 23.4% for Germany, 22.3% for France, 18.2% for the United States. The right formulation is therefore not "the oldest in the world," but "the oldest country of any significant size." This kind of precision is not pedantry: it is what separates a number from a slogan.
The dividend, and why it is not automatic
Demography does not only take away. It gives, too, and for a few decades it gives a great deal.
When a country moves from high fertility to low fertility, it passes through a window: the children are already fewer, the old are not yet many, and the working-age share of the population swells. More producers, fewer mouths to feed per producer. That window has a name — the demographic dividend — and it explains a good part of what was called the Asian miracle.
The number belongs to David Bloom and Jeffrey Williamson, in 1998. Between 1965 and 1990, East Asia's working-age population grew by 2.39% a year, against 1.58% for the total population and 0.25% for the dependent population. The result: population dynamics explain between 1.37 and 1.87 points of annual GDP-per-capita growth, or up to a third of the miracle — whose growth ran at 6.11% a year.
A point of usage, because it travels badly: the term "demographic dividend" is not from that paper. Bloom and Williamson wrote of a demographic gift — the word "dividend" does not appear in it once. It is the Bloom, Canning and Sevilla report that makes it stick, five years later, in 2003. A gift can go to waste; a dividend, you count on.
And here is the point everyone forgets: this dividend was never promised to anyone. It is in the 1998 abstract, in so many words: "This effect was not inevitable; rather, it occurred because East Asian countries had social, economic, and political institutions and policies that allowed them to realize the growth potential created by the transition." And elsewhere in the same text: the demographic "gift" in the middle phase of the transition "may or may not be realized. It represents a growth potential whose realization depends on other features of the social, economic, and political environment."
The counter-example exists, and it comes with numbers. From 1970 onwards, Latin America went through a demographic transition comparable to East Asia's: fertility there falls from 5 children per woman to around 2.5, infant mortality from 91 to 32 per thousand — a level almost identical to Asia's. The demographic boost was measured there at between 0.74 and 1.54 points a year, almost as much as in Asia as a whole. And GDP-per-capita growth, between 1975 and 1995? 0.7% a year — an eighth of East Asia's.
What happened? Nothing. That is precisely the problem. The 2003 report puts a number on one of the missing ingredients: a country whose working-age population grows 1.5 points faster than its total population gains 0.5 points of growth a year if its economy is closed, and 1.5 points if it is open. In other words, trade openness triples the dividend. And in 1980, only 12% of Latin America counted as "open." The authors' counterfactual is brutal: fully open between 1965 and 1985, the region would have grown 0.9 points faster a year — double what it managed.
Demography opens a window. It does not climb through it for you.
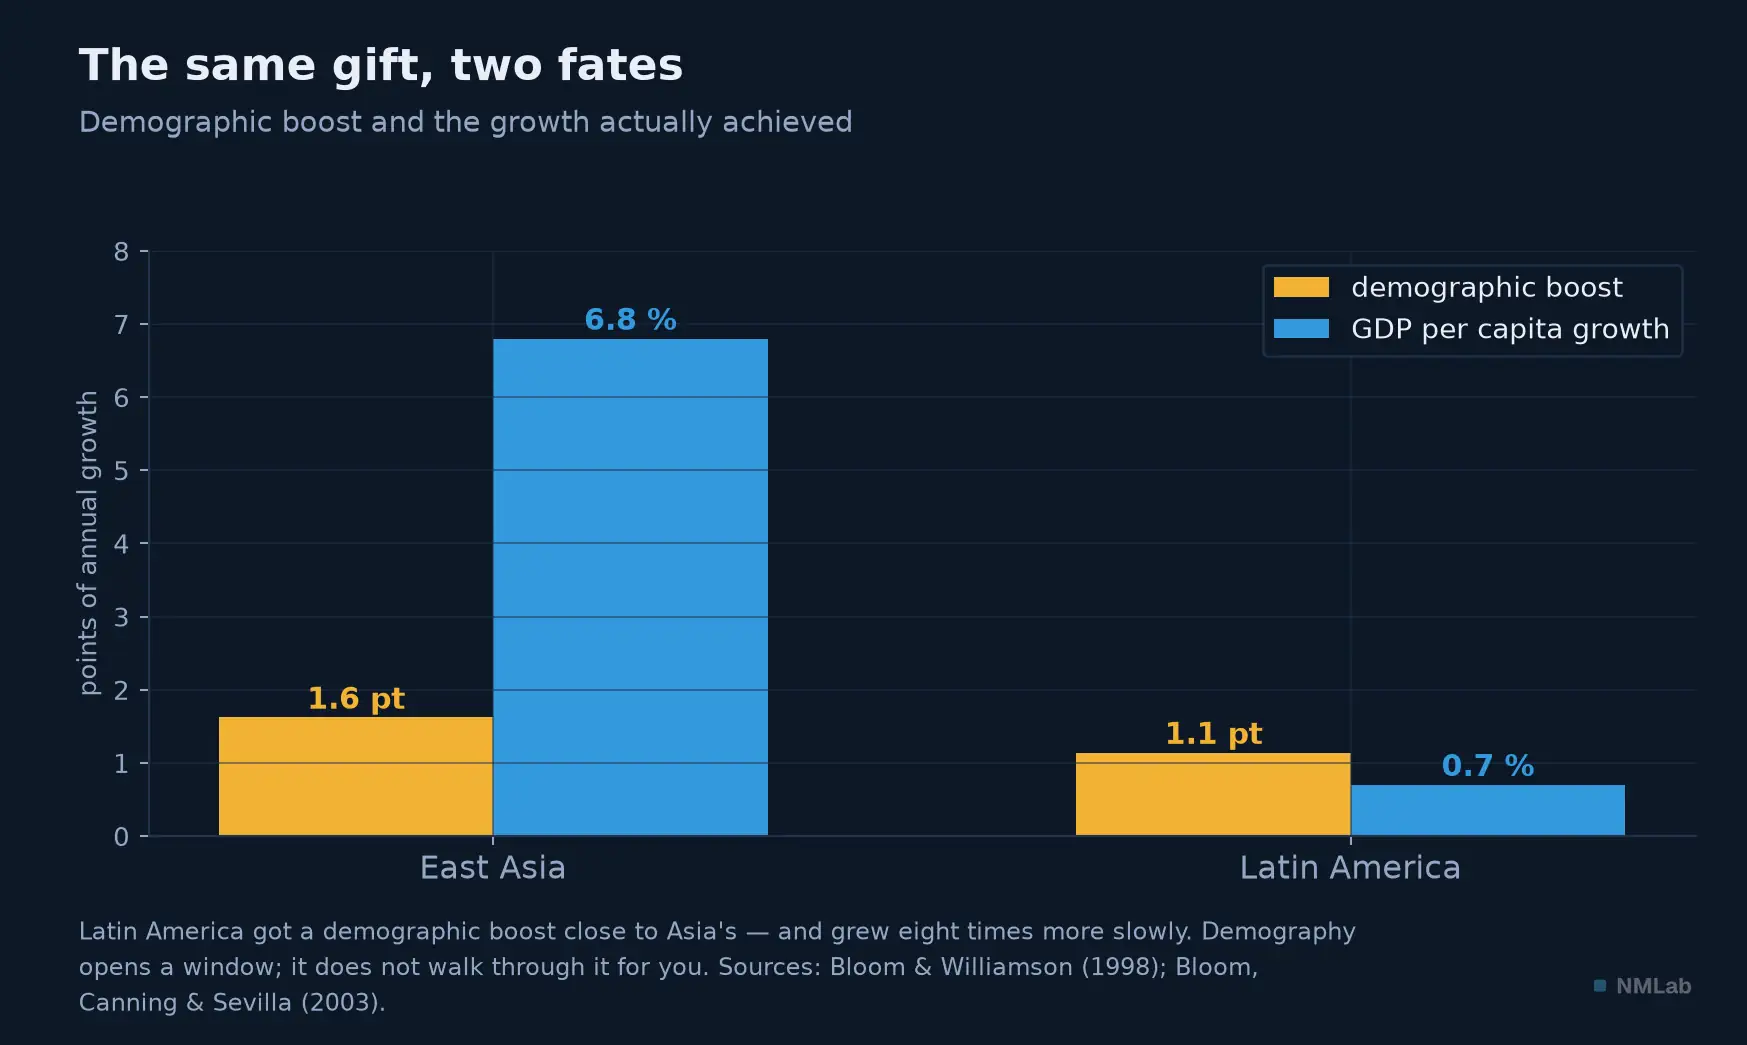
Two regions, an almost identical demographic gift, and growth eight times apart. What separates them is not population: it is policy.
Where the wind blows now
Now look at the map, because it has changed.
China has closed its window. India has dropped below the replacement threshold: its fertility rate stands at 1.9 children per woman in 2024 according to its own official register — 2.1 in rural areas, 1.5 in the cities, and only six states still above the threshold. The country is still young — median age 28.4 — and its working-age share will peak around 2034, but India will grow old before it grows rich. Fernández-Villaverde and his co-authors make it the exact mirror of Japan: "In contrast, India is the mirror image of Japan: very fast growth of the working-age adult population means that the high rates of total GDP growth look less impressive in terms of working-age adults." Indian growth 1991-2019: 6.44% on total GDP, but 4.25% per working-age person.
And India's obstacle is not demography — it is employment. Female labor-force participation there is 40.0%, against 79.1% for men. The UN sets out its conditions: "reaping the maximum potential benefit requires sufficient improvements in education, health, gender equality and gainful employment." A list of work to be done, not a promise.
Sub-Saharan Africa, for its part, inherits the window. While world fertility was falling from 3.31 children per woman in 1990 to 2.25, its own stayed at 4.1. The rest reads in billions: 1.24 in 2024, 2.09 in 2050, 3.35 in 2100. One calculation is enough to measure the tipping point: between 2024 and 2100, sub-Saharan Africa contributes more than 100% of the net growth of the world's population. It grows by more than the whole world does — because the rest of the world, for its part, is contracting.
For that is the other piece of news. The world's population will peak around 2084, at 10.3 billion, before declining; the UN puts an 80% probability on a peak within this century. In population terms, Pakistan will overtake the United States in 2054, Nigeria and the Democratic Republic of the Congo in 2100. The wind has changed direction.
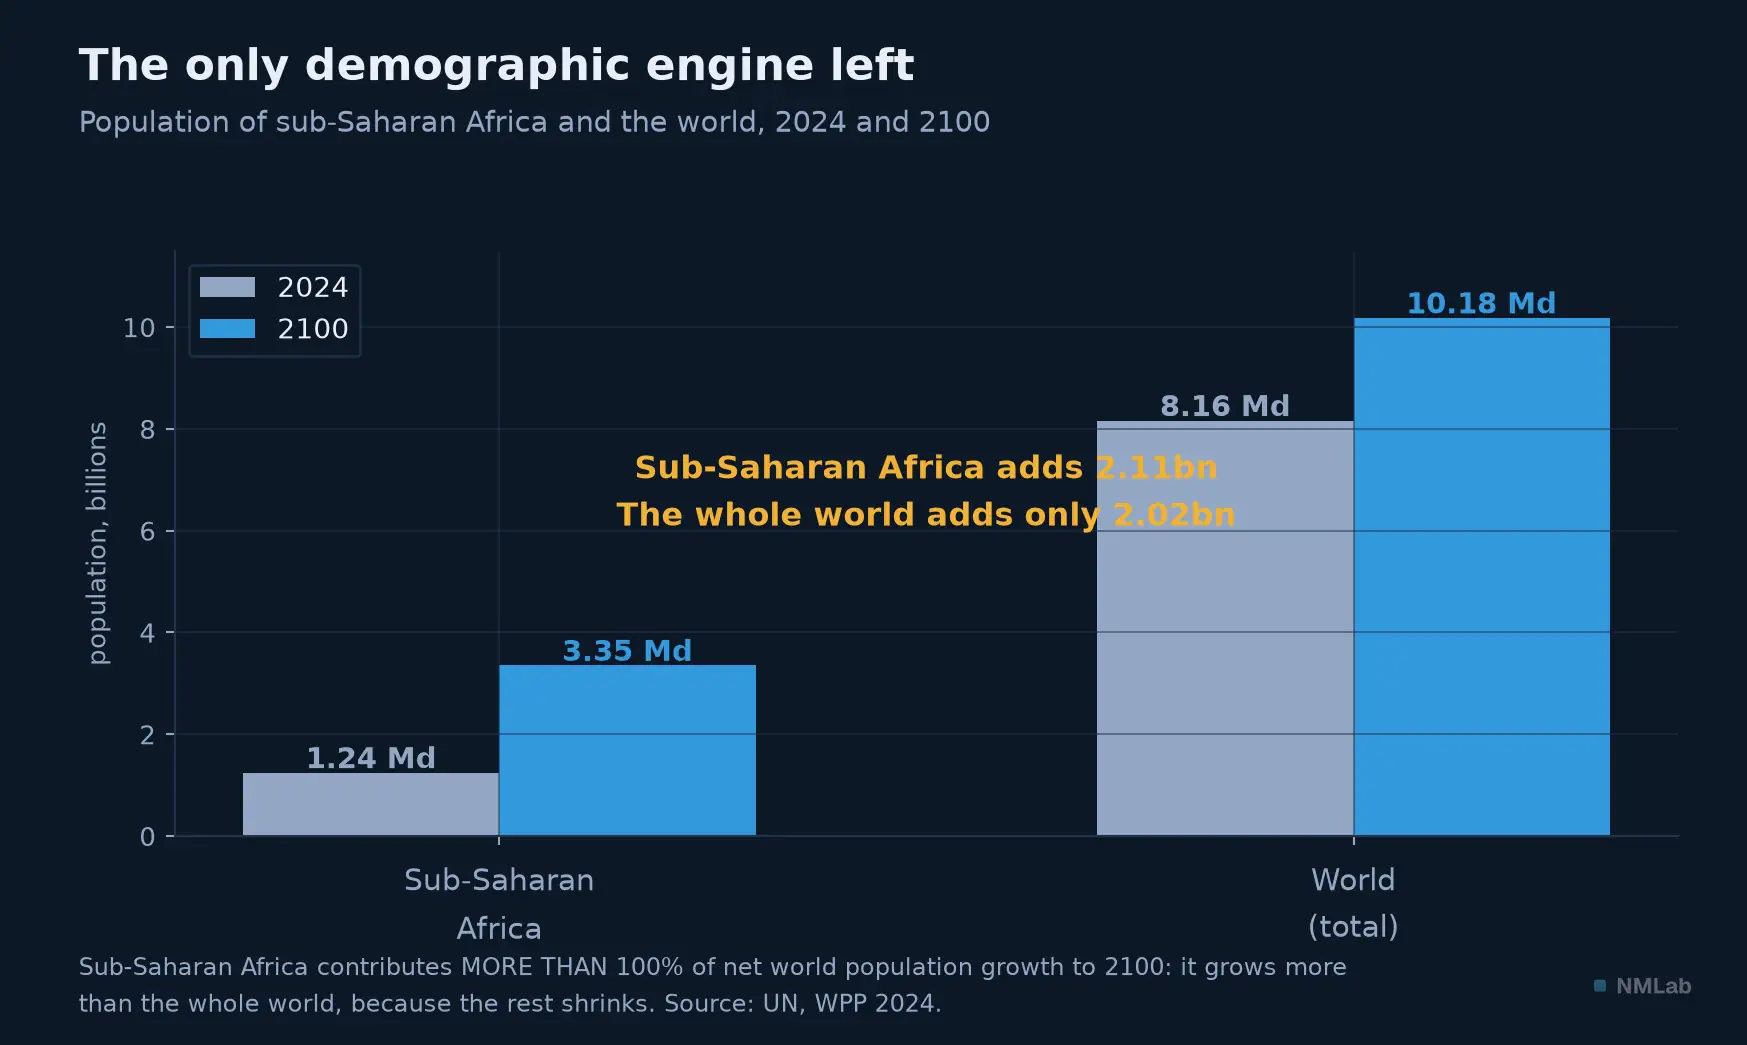
With the rest of the world contracting, sub-Saharan Africa alone contributes more than humanity's net growth.
What this changes for a portfolio
Three channels, from the soundest to the most contested.
The first is mechanical and certain: fewer working-age adults, less total GDP growth, at a given productivity. What counts for your investments is not the drama, it is the denominator. A country losing 0.5% of its working-age adults a year and gaining 1.5% of productivity grows by 1%. That is not a catastrophe — that is Japan, and its standard of living went on rising. But debt is measured against total GDP: that is where ageing bites, not on living standards.
The second matters most to you, and chapter 11 prepared you for it: population growth behaves exactly like a share issue. Dimson, Marsh and Staunton draw the decisive analogy — when a company issues securities, the money funds future growth, but the new shares dilute existing earnings; "similarly, for a nation with an influx of population, GDP per capita may be enlarged or reduced through the process of sharing the benefits among a larger pool of citizens." That is why — and chapter 11 showed it — the correlation between growth and returns is negative with GDP per capita and positive (+0.51) with aggregate GDP. The difference between the two is exactly demography.
The third is open, and it must be said honestly. Does ageing push interest rates up or down? The standard view answers: the old have saved, savings are abundant, the natural rate sags. The opposite thesis — that of Charles Goodhart and Manoj Pradhan — holds that retirees dissave, that labor grows scarce, and that ageing is therefore inflationary. The debate is not settled, and the data since 2020 have not settled it either. What chapter 11 established, on the other hand, holds: in central banks' reference model, the natural rate follows trend growth point for point — and demography is half of that trend growth.
One last word on what demography does not determine. The Bank of Japan made an observation that should cool every automatic line of reasoning: "Labor markets remained loose despite demographic decline." Japanese wages only began to tighten in the mid-2010s, and for another reason. Over that same stretch, Japanese women's participation rate went from 60% to 78%, and that of the over-65s passed 25% — enough to offset, and more, the fall in the number of working-age adults. Demography supplies the raw material; institutions decide what is made of it.
Key takeaway
- The equation — GDP growth ≈ working-age population growth + productivity growth (exact per worker; per hour, add hours worked). Its first term is known thirty years ahead.
- Japan did not stagnate, it shrank — Working-age population at its peak in 1995, thirteen years before the total population: 87 → 73.3 million, or −15.7%. Over 1991-2019, GDP per working-age person grows there by 1.39% a year against 1.65% in the United States — a 0.26-point gap, against 1.75 on total GDP. From 2008 to 2019, Japan posts the best score in the G7 on that measure.
- The speed, not the level — Japan aged last but fastest: 24 years to go from 7% to 14% seniors, against 115 for France. Record already beaten by South Korea (18 years). Its dependency ratio has tripled in thirty-five years (17.3 → 49.2%).
- The demographic dividend, never automatic — The window in which working-age adults grow faster than dependents explained up to a third of the East Asian miracle (1.4 to 1.9 points out of 6.11% a year). But it was written as early as 1998: "this effect was not inevitable." Latin America received an almost equivalent boost and grew by only 0.7% a year against 6.11% in East Asia — trade openness triples the dividend.
- The map has changed — India is below the replacement threshold (1.9) and will grow old before it grows rich; its real obstacle is female participation (40%). Sub-Saharan Africa contributes more than 100% of the net growth of the world's population by 2100. The world peaks around 2084 at 10.3 billion.
- For your investments — Demography is to a country what a share issue is to a company: it dilutes. That is why the growth/returns correlation is negative per capita and +0.51 in aggregate. On interest rates, the debate remains open.
The journey ahead
You now know what lifts the tide: hands and productivity — one predictable, the other not. One question remains, which we have been dodging for three chapters: at any given moment, how do you know whether an economy is running at full capacity or below it? Because the growth it can sustain without overheating is not the growth it delivers. The gap between the two has a name, it is invisible, it is massively revised, and central banks steer by it — which ought to worry you a little. Next chapter: « Potential Growth and the Output Gap: The Map No One Can Measure ». Before we get there, open your country's population pyramid and look at the width of the 45-55 bar. You have just read your next twenty years of potential growth in a chart nobody comments on.
Sources and further reading
- Jesús Fernández-Villaverde, Gustavo Ventura & Wen Yao, "The Wealth of Working Nations," NBER Working Paper 31914, November 2023, revised August 2024; published in European Economic Review, vol. 173, 2025, article 104962 — the G7 table, "suddenly, there is nothing enigmatic about Japan's GDP growth," and India as the mirror image of Japan.
- David E. Bloom & Jeffrey G. Williamson, "Demographic Transitions and Economic Miracles in Emerging Asia," The World Bank Economic Review, 12(3), September 1998, pp. 419-455 — the 1.37 to 1.87 points, "up to a third of the miracle," and the warning that the gift "may or may not be realized."
- David E. Bloom, David Canning & Jaypee Sevilla, The Demographic Dividend: A New Perspective on the Economic Consequences of Population Change, RAND Corporation, MR-1274, 2003 — the reference that popularized the term, the quantified Latin American counter-example and the trade openness that triples the dividend.
- Kazuo Ueda, Governor of the Bank of Japan, Jackson Hole speech, August 23, 2025 — the two peaks (working-age population in 1995, total population in 2008), labor markets that remained loose, and the rise in participation among women and seniors.
- Statistics Bureau of Japan, 2025 census (preliminary count published May 29, 2026): 123,049,524 inhabitants as of October 1, 2025, −2.5% in five years; Statistical Handbook of Japan 2025 for the age structure; Cabinet Office, White Paper on the Japanese Economy (2003) for the comparative ageing durations.
- Randall S. Jones, "Addressing demographic headwinds in Japan: a long-term perspective," OECD, ECO/WKP(2024)4, April 2024 — the dependency ratio projected at 79% by 2050 and Korea's overtaking.
- Registrar General of India, SRS Statistical Report 2024 — the fertility rate at 1.9 (2.1 rural, 1.5 urban) and the six states still above the replacement threshold; MoSPI, Periodic Labour Force Survey Annual Report 2025 (March 27, 2026) for participation rates.
- United Nations, DESA, World Population Prospects 2024 — the world peak "around 10.3 billion in the mid-2080s," world fertility at 2.25 against 3.31 in 1990, the sub-Saharan Africa projections and the box on the dividend's conditions.
- Dimson, Marsh & Staunton, "The growth puzzle," Credit Suisse Global Investment Returns Yearbook 2014 — the analogy between population growth and share issuance, and the +0.51 correlation with aggregate GDP.
- Charles Goodhart & Manoj Pradhan, The Great Demographic Reversal, Palgrave Macmillan, 2020 — the case for inflationary ageing, to be set against the standard view.
- Figure data: Bank of Japan and BLS via FRED (LFWA64TTJPM647S, LFWA64TTUSM647S, POPTHM), United Nations (World Population Prospects 2024), World Bank — vintage of July 15, 2026.