13. AI, Automation and Productivity: A New Engine of Growth?
· Updated on · 23 min read
On June 5, 2026, the research institute Epoch AI publishes a chart that looks like nothing. It shows two curves: on one side, the money the cloud giants spend on data centers; on the other, the money their business brings in. For years, the first ran below the second — they were investing less than they earned. That year, around the third quarter, the curves cross.
An accounting detail, and the end of an argument. For three years, those who refused to speak of a bubble around artificial intelligence had an unanswerable reply: this isn't 1999, they're paying cash. The telecom operators of the previous bubble had borrowed to the hilt to bury fiber no one lit; the hyperscalers, by contrast, were funding their data centers out of cash flow. The argument was sound. It has just stopped being true.
This chapter deals with the hardest question in the whole module, because it is the only one whose answer does not yet exist. Will AI revive growth? We will see that one fact is solid, and it is not the one you'd expect: American productivity really did accelerate — and it probably was not thanks to AI.
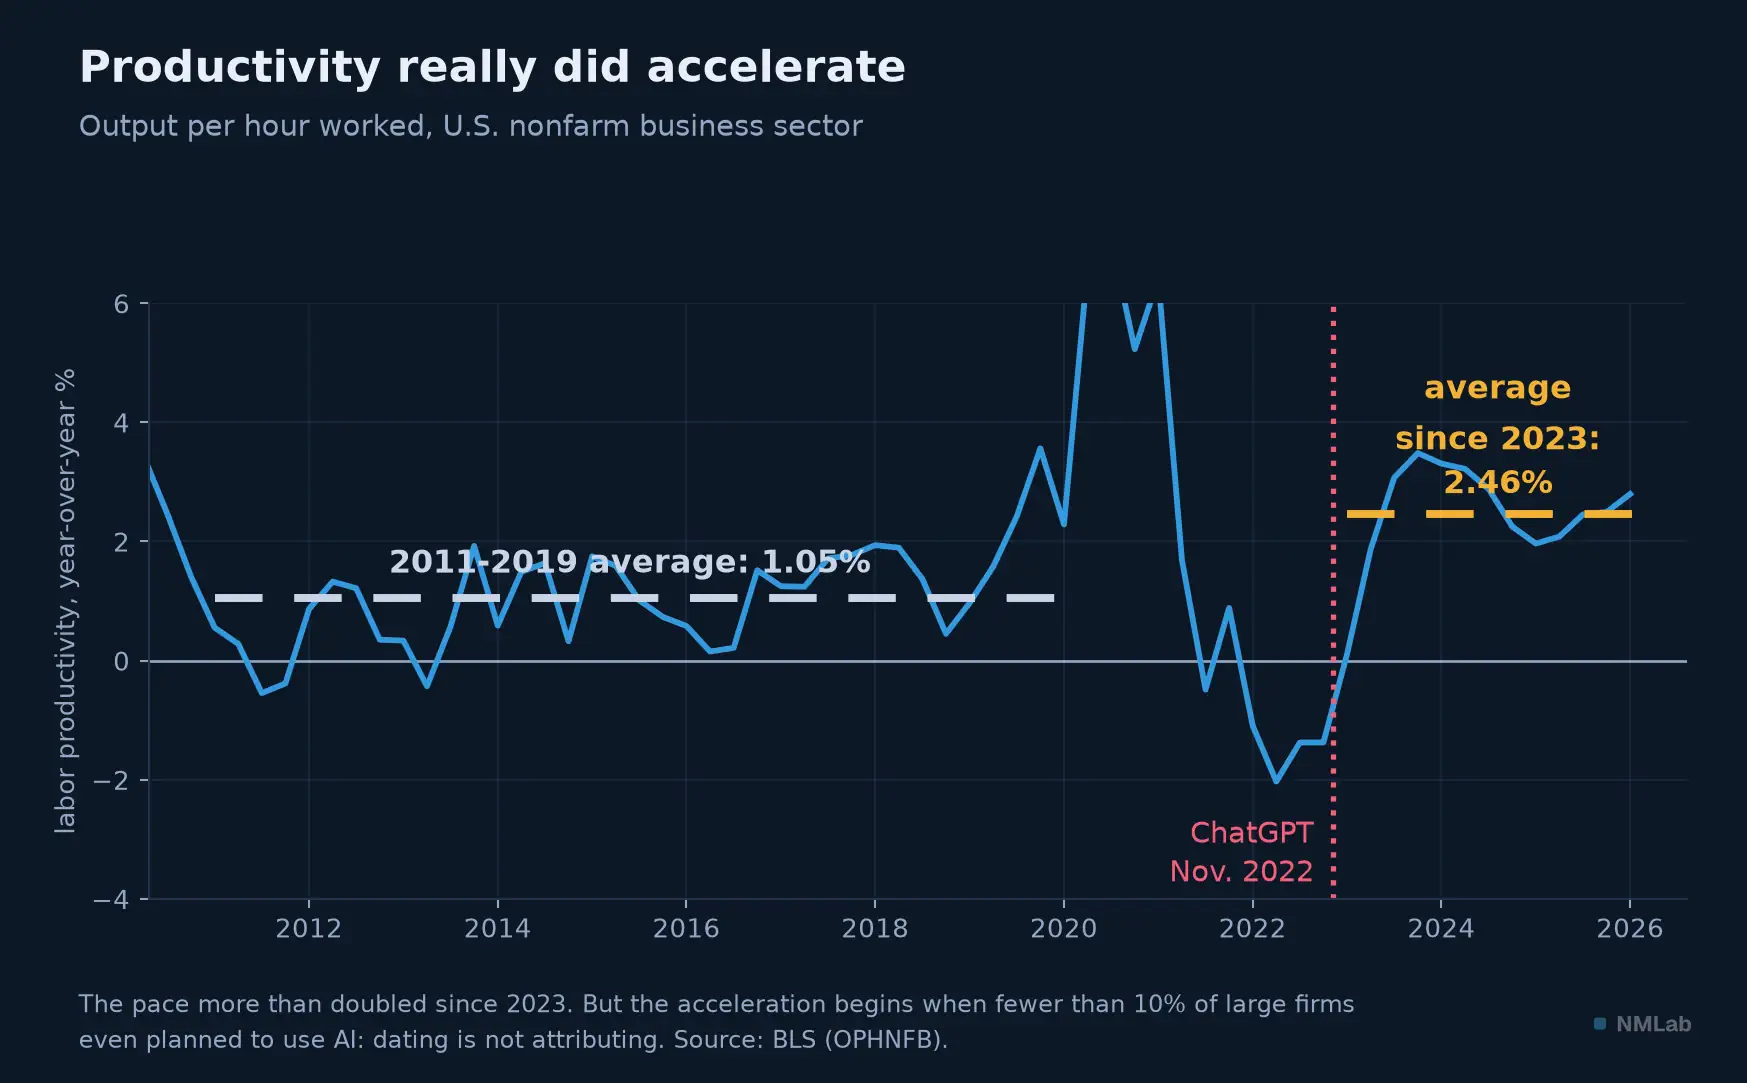
The pace more than doubled. But the acceleration begins when fewer than 10% of large firms even planned to use AI.

At a glance — Analysis piece (not a course chapter) · Level: Advanced · Prerequisites: chapter 12
By the end of this piece, you will be able to:
- explain why dating is not attributing, and what the productivity acceleration owes — or does not owe — to AI;
- take apart a headline number of job cuts "caused by AI";
- name the financial signals worth watching, and what the comparison with 1999 is really worth.
This piece rests on data as of July 2026: the adoption, capex and employment figures age fast. The mechanisms do not.
The fact no one disputes
Let's start with what is measured, not with what is told. American labor productivity — output per hour worked in nonfarm business, the series chapter 12 taught you to read — grew by 2.43% a year between 2022 and 2025, whereas over 2011-2019 it averaged 1.05%. The pace more than doubled. (Chapter 12 quoted 2.18%: its window opened in 2019 and swallowed the statistical chaos of 2020-2021. Starting in 2022 isolates the acceleration — same series, different windows.) Total factor productivity tells the same story: 0.53% a year over 2005-2019, 1.04% since 2019. Chapter 12 showed you what a point and a half of productivity does over a generation: 39% of living standards. If this pace holds, it is the macroeconomic event of the decade.
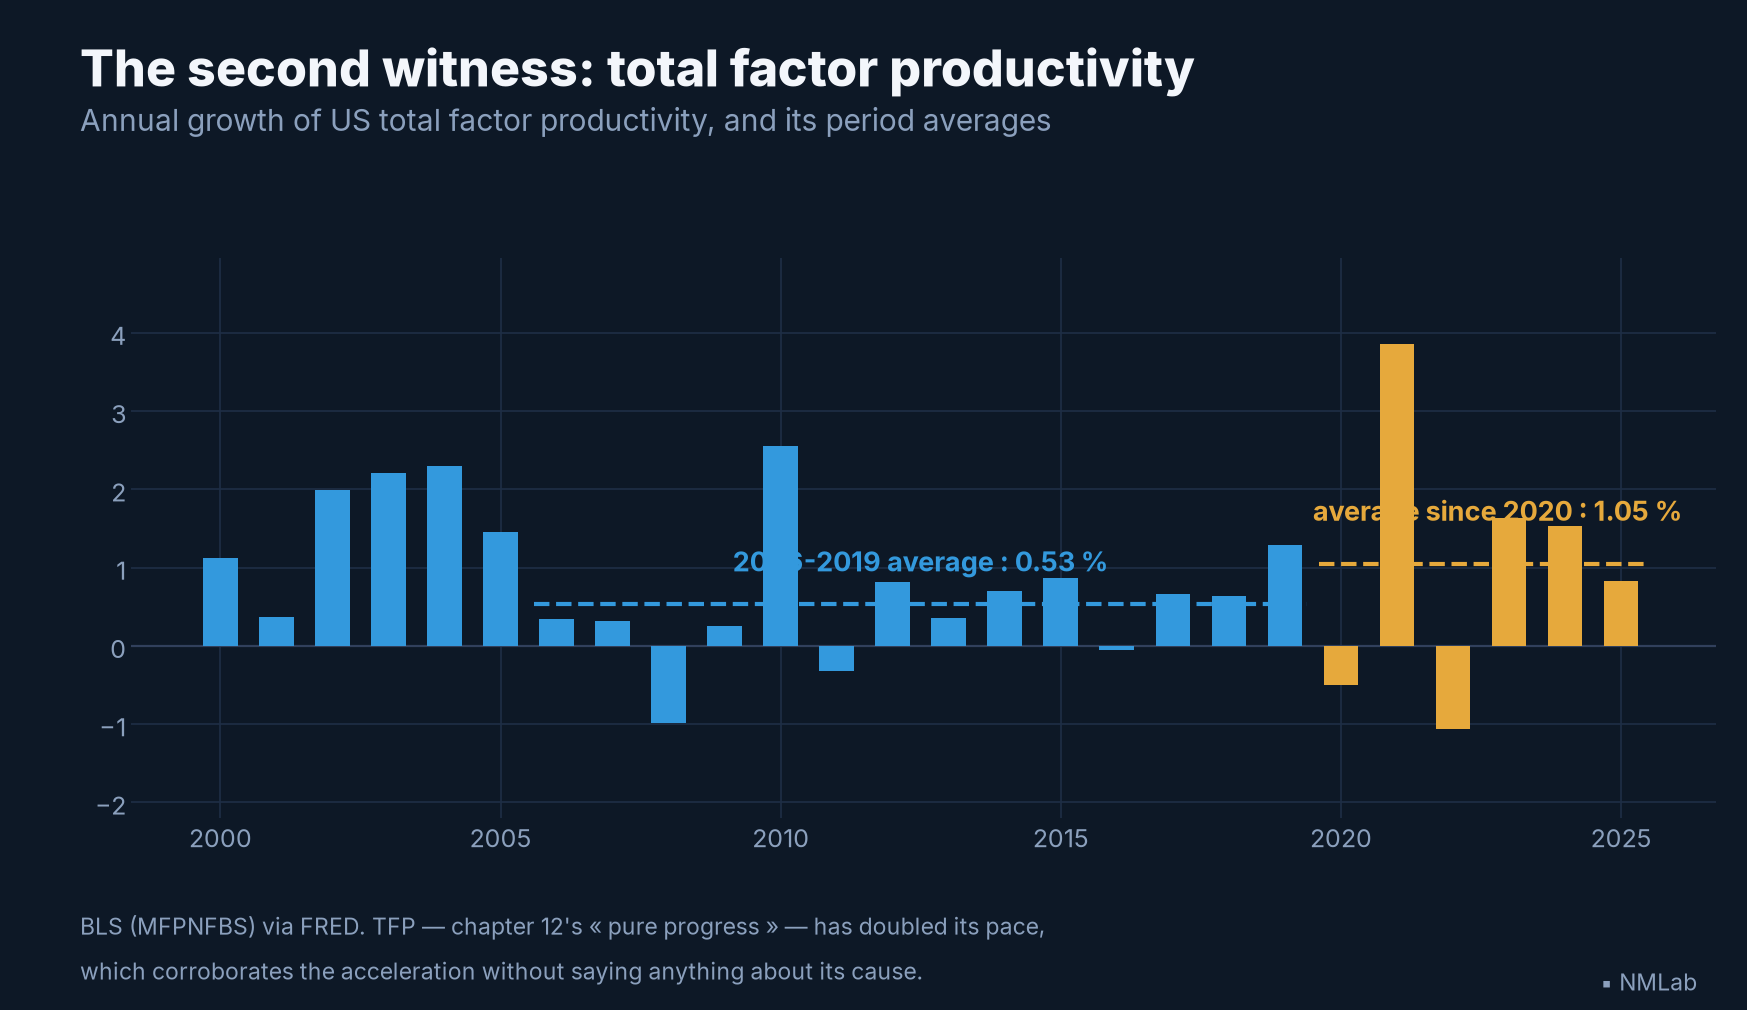
The second witness says what the first one said: TFP has doubled its pace. Corroborating is not explaining — neither figure names AI.
So — AI? That is the natural inference: ChatGPT comes out at the end of 2022, productivity takes off in 2023; post hoc, ergo propter hoc. Except that dating is not attributing, and that is the whole subject of this chapter.
The calendar problem
Here is the first obstacle, and it is brutal: when American productivity accelerates, in 2023, almost nobody is using AI. The figure comes from the U.S. Census Bureau, which surveys more than a million firms every quarter. In the fourth quarter of 2023, fewer than 10% of large firms even planned to use AI within six months; two years later, in the third quarter of 2025, adoption by large firms had reached only 12%. Twelve percent: that is the penetration rate supposed to have doubled the productivity of a thirty-trillion-dollar economy.
The alternative explanation is prosaic and solid: post-pandemic reallocation. Millions of people changed jobs, often for a better one; firms closed, others were born at a record pace; supply chains untangled. That is exactly the kind of shock that produces what we observe — a productivity jump lasting a few years, with no miracle technology. Which does not mean AI has nothing to do with it; it means we do not know, and that anyone who claims otherwise is selling you something.
A second check, this one ex ante, points the same way. Daron Acemoglu set out to quantify what AI can reasonably deliver to the macroeconomy, task by task rather than by extrapolation: his estimate yields a cumulative gain in total factor productivity of less than 1% over ten years — a few hundredths of a point a year, nowhere near the acceleration observed since 2022. His assumptions are contested, and abundantly so; but the order-of-magnitude gap between what cautious models predict and what the numbers actually did forbids crediting AI, absent further evidence, with a doubling of the pace.
And Europe? Eurostat, with a different questionnaire, finds 19.9% of EU enterprises using at least one AI technology in 2025 — 55.0% among large ones — against 13.5% overall a year earlier. Resist the temptation to conclude that Europe is four times ahead of America: the Census asks whether the firm used AI to produce a good or service in the past two weeks; Eurostat, whether it uses at least one AI technology — a far broader definition. Two questions, two figures that do not compare: this is the reflex of chapter 6, read the definition before the number. What both series do say together is that adoption is genuinely accelerating — in 2025, that is, two years after the productivity acceleration it is credited with.
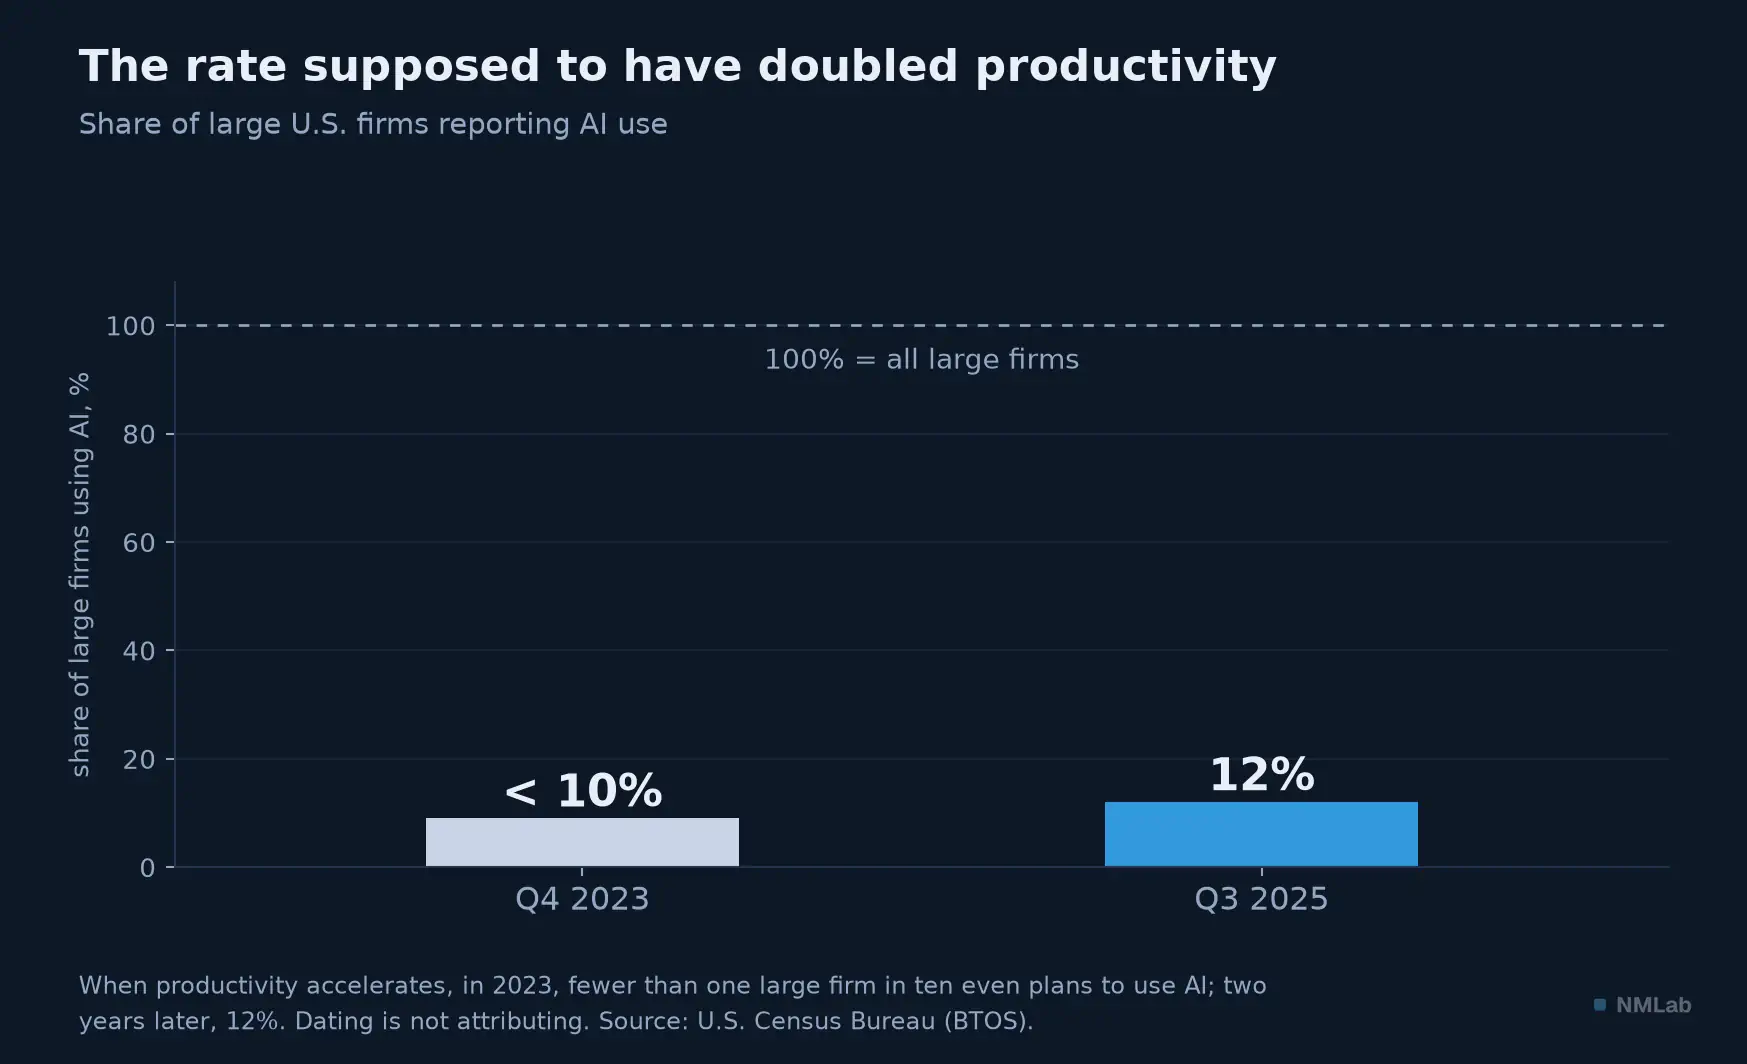
Twelve percent adoption, on a scale where 100% would be every firm: that is little for an engine supposed to transform a thirty-trillion-dollar economy.
The best case on the other side: the controlled experiments
This argument would not be honest if it passed over the ground on which the other camp is strongest — and that ground is not the macro series, it is the experiments. Since 2023, several randomized trials have measured the effect of generative AI not on an economy but on workers assigned at random to the tool or to its absence. Their results are clear, and they all point the same way.
Start with writing. Shakked Noy and Whitney Zhang, in Science in 2023, gave professional writing tasks to graduates: time spent fell 40% and rated quality rose 18%. The field does one better. Erik Brynjolfsson, Danielle Li and Lindsey Raymond followed more than five thousand customer-support agents equipped with an assistant: +14% of issues resolved per hour, but +34% for novices and close to nothing for the most experienced. Remember the asymmetry. On Boston Consulting Group consultants, Fabrizio Dell'Acqua and co-authors measured 12% more tasks completed, 25% faster, with quality 40% higher; on developers equipped with GitHub Copilot, Sida Peng and co-authors record a task finished 56% faster.
These numbers are real, and it would be absurd to wave them away. But note what they measure: the effect on one task, chosen for its exposure to the tool, over hours or months. Three steps separate that result from a point of national productivity. The task must weigh in actual working time; the firm must be equipped — we are at 12%; and the time saved must convert into extra output rather than into time returned or work redone. Multiply through: a 30% gain on a task filling a fifth of the time, in one firm in eight, comes to a fraction of a point — and lands precisely on Acemoglu's order of magnitude.
Dell'Acqua's experiment adds a warning the summaries drop: outside what the authors call the "jagged frontier" of the model's capabilities, on a task designed to trip it up, the equipped consultants did worse than the others. The tool helps a great deal where it is good, and hurts where it is not — without warning. Nothing in this literature, then, contradicts the timing problem: it explains why AI will probably end up mattering, and why it cannot explain what has already happened. That is, word for word, the lesson of the dynamo from chapter 12: the technology arrives first, organizations remake themselves next, the statistics record last.
Employment: what is measured, what is attributed
It is on employment that the gap between the story and the data becomes vertiginous. The firm Challenger, Gray & Christmas tracks announced job cuts in the United States: in the first half of 2026, 443,604 announced cuts, of which 101,743 cited artificial intelligence — 23%. The figure made headlines everywhere. Three points empty it of substance.
First, these are announcements, not layoffs, and the reason is the one the employer declares: Challenger verifies nothing — it even writes that AI was « cited in » these announcements, not that it caused them. The firm doubts its own attributions so much that one of its categories is literally titled « technological update (possibly AI) »; the word « possibly » is theirs. Second, the order of magnitude: real layoffs in the United States, measured by the BLS's JOLTS survey, run at 1.7 million a month — a rate of 1.1%, historically low. The 101,743 announcements attributed to AI represent about 17,000 a month, that is about 1% of actual layoffs: the figure that alarms lives in the statistical noise of the American labor market.
Third, and most telling, the total is down 40% year on year. In 2025, American employers had announced 1,206,374 cuts — and AI then explained only 54,836, or 4.5%; that year's wave was federal (293,753 cuts attributed to cuts in the administration). In other words, between 2025 and 2026, the volume of layoffs collapses while the share attributed to AI quintuples. This is not a wave of technological destruction: it is a change of narrative. Challenger's own boss says as much, in his way: stripping out the 2025 federal layoffs, « the 2026 announcements closely track the 2025 pattern »; and on the mechanism, « firms are shifting budgets toward AI at the expense of jobs » — which is a budget reallocation, not a technical substitution. The nuance is crucial: in one case the machine does the work, in the other you cut elsewhere to pay for the machine.
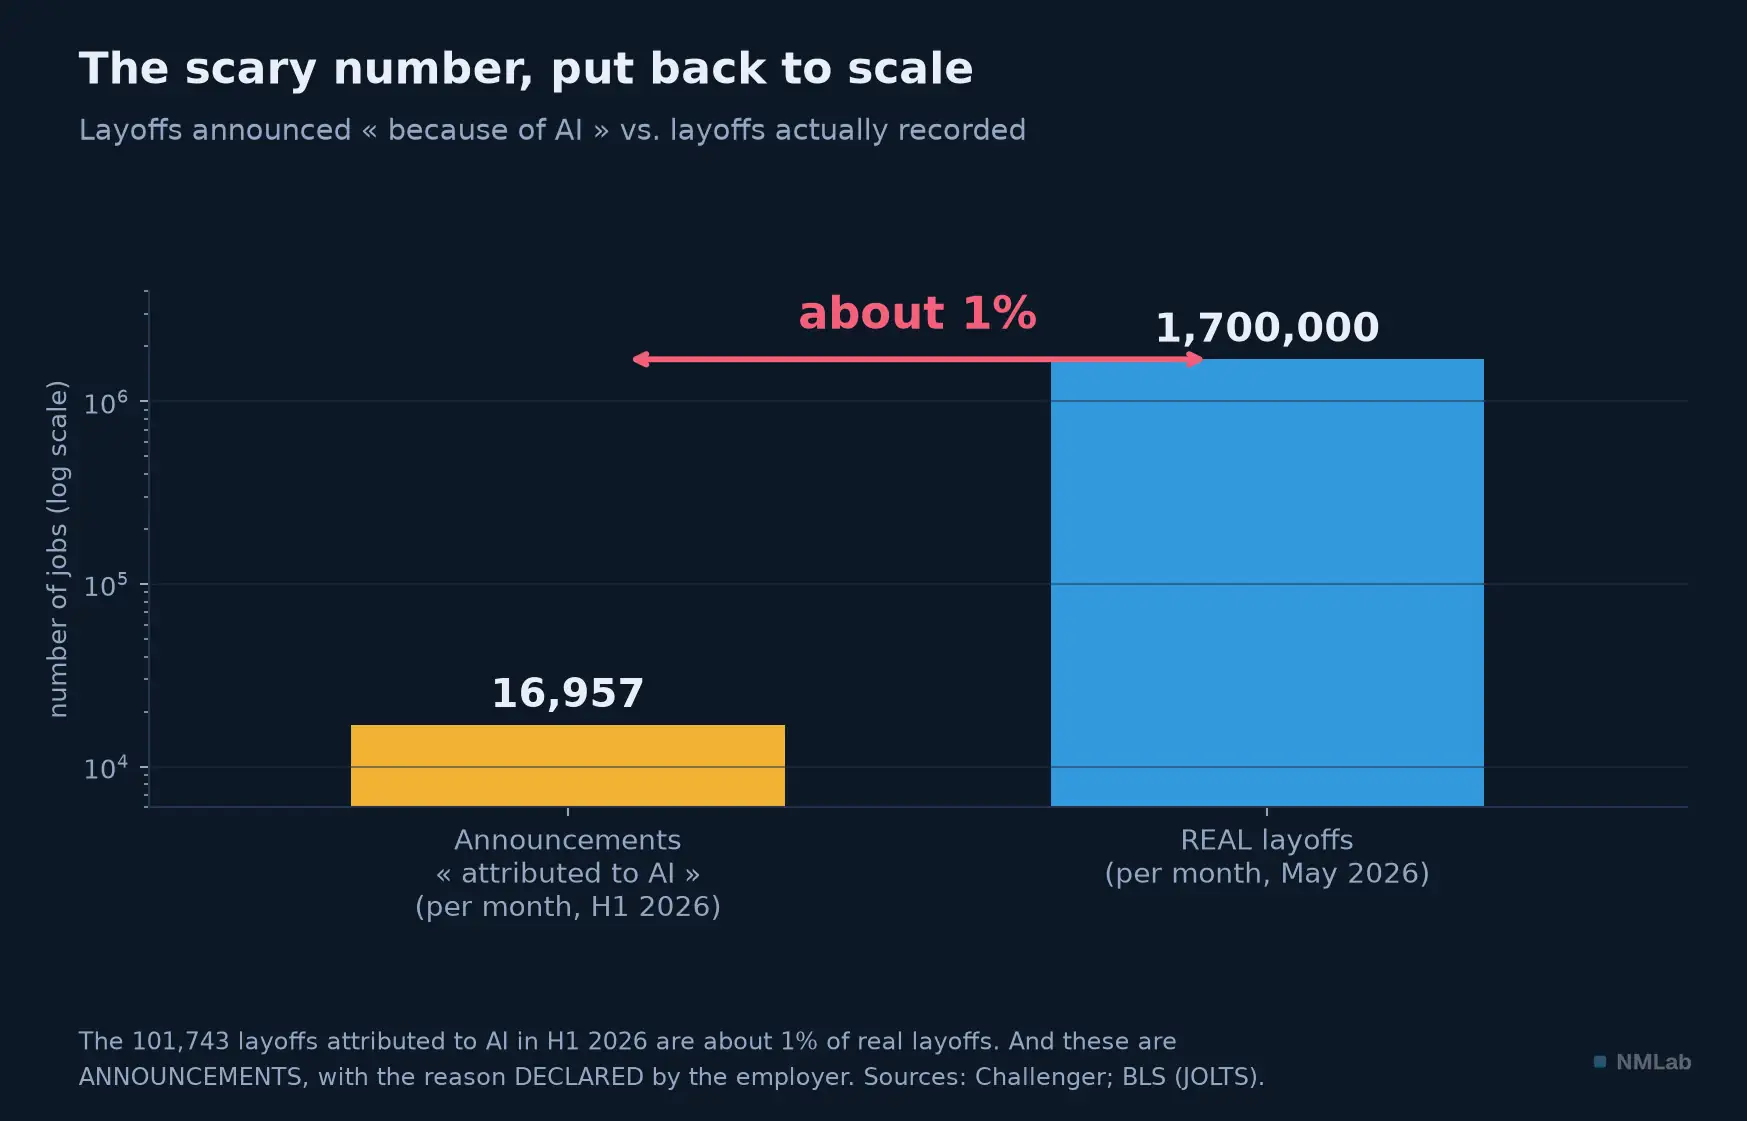
A hundred thousand jobs « attributed to AI » in six months, against 1.7 million real layoffs a month: about one percent.
What the official data say
And if we simply looked at the employment figures? Unemployment among 20-24-year-olds — the cohort supposedly decimated by AI — went from 8.2% in June 2025 to 7.1% in June 2026: it fell by more than a point during the very year that attribution of layoffs to AI was exploding, and it is the 25-34-year-olds who are deteriorating (3.8% → 4.6%), not the « canary » cohort. Do not overplay this figure. An aggregate rate ignores exposed occupations, the series is volatile, and an unemployment rate can fall because people leave the labor force — the U.S. participation rate fell exactly 0.3 point in June. Still, the sector most exposed among white-collar work, professional services, created 172,000 jobs since its low of October 2025.
Let's turn to the serious studies, because they seem to contradict one another. Stanford produced the most-cited study: on ADP payroll data, Erik Brynjolfsson and co-authors find that workers aged 22 to 25 in AI-exposed jobs saw a relative employment decline of 16%. The paper's title — Canaries in the Coal Mine? — carries a question mark, and it is deserved: the raw decline is only 6%, the 16% coming after controls; and the authors write in black and white that their estimates « may be affected by factors other than generative AI », and that better adoption data would be needed « to estimate plausibly causal effects ». They do not claim causality. Yale redid the test on the official BLS survey, with a different method: « no impact is visible » on employment or wages — but Yale adds the decisive caveat, and honesty demands quoting it: their source « is better suited to analyzing broad groups and lacks the power for subgroup analysis », and « if AI's labor-market effects are for now confined to a narrow slice of the workforce, other datasets would be better suited to identifying them ».
That is why Stanford and Yale do not necessarily contradict each other: Yale measures the aggregate with an instrument it declares too coarse for a narrow slice, while Stanford measures the narrow slice without causal identification. The disagreement is about the resolution of the instruments, not about the facts. The rest converges. The Federal Reserve, on job postings crossed with actual AI adoption, finds « no evidence of a reduction in postings » in the sectors or firms that adopted AI the most. A survey of 750 executives published by the NBER records « little evidence of an aggregate decline in employment in the short run », but a reallocation — routine administrative roles recede —, with, in passing, a delicious admission: executives perceive productivity gains larger than the ones we measure. The most defensible synthesis came on July 14, 2026, from the pen of a Fed governor, Michael Barr: « At present, there is little evidence of economy-wide job displacement from AI. There is, nonetheless, some evidence that AI may have made entering the labor market harder for young workers in certain job categories. »
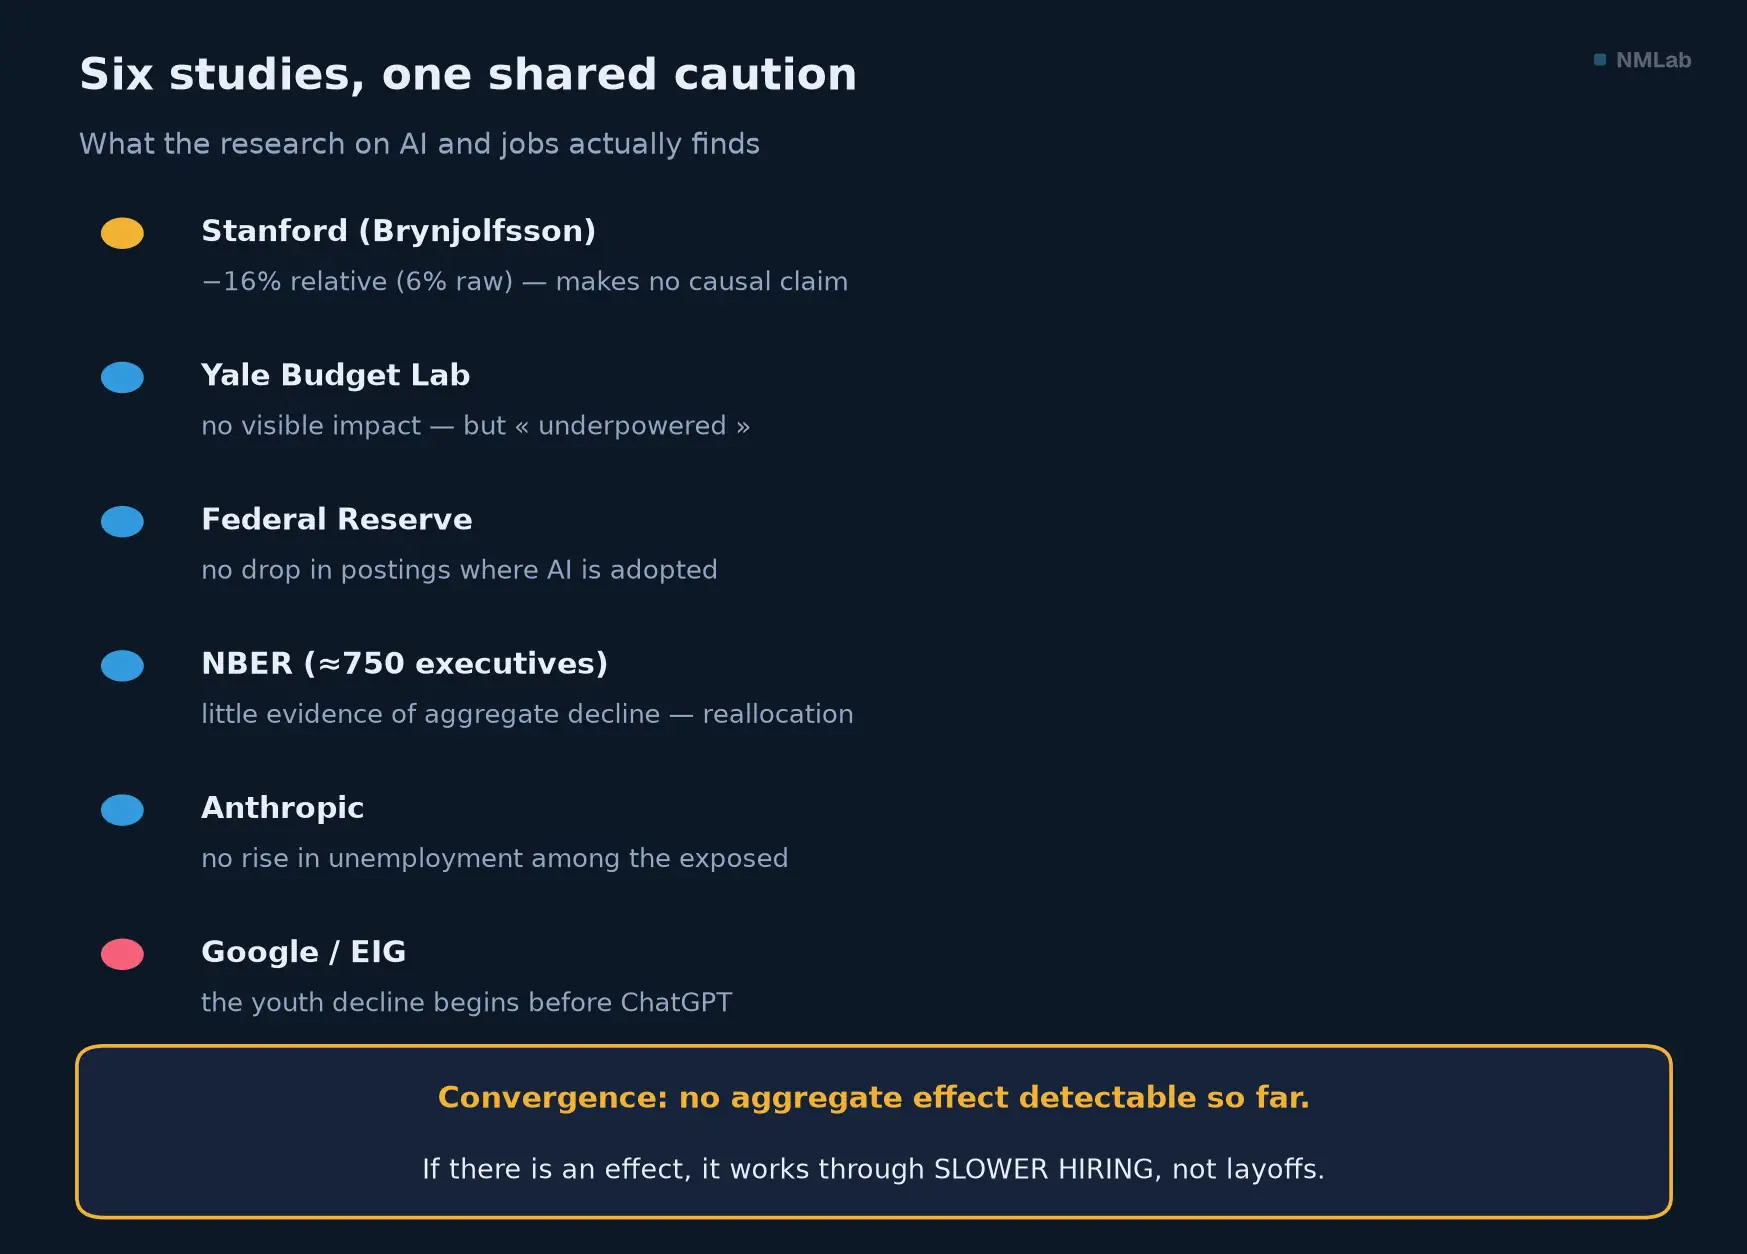
Six independent works, one shared caution: no detectable aggregate effect, and if one exists, it works through hiring, not layoffs.
The conflict of interest, and why it is not enough
A delicious detail, and it must be said: the most solid critique of the « AI destroys junior jobs » thesis is signed by two economists… from Google. Their argument is excellent — the decline in young workers' employment in exposed jobs begins six months before ChatGPT, in March 2022, exactly when the Fed launches the most violent tightening in forty years; 38% of the workers most exposed to AI are in the sectors most sensitive to rates, against less than 2% of the least exposed. And above all, they show that an occupation subject to a simple hiring freeze, without a single layoff, would mechanically see the employment of its 22-25-year-olds fall by 25%, the cohort being too narrow to replenish otherwise. Symmetrically, the most reassuring paper is published by Anthropic, from its own product's usage data: it finds « no systematic rise in unemployment » among exposed workers, while noting a slowdown in youth hiring « barely statistically significant ». A detail worth the detour: its research arm publishes results far more sober than the public predictions of its own chief executive, who announced in May 2025 the disappearance of half of entry-level office jobs in five years.
Two AI firms, two reputational interests, two conclusions that suit them: the reversed argument from authority would be tempting. It does not hold, for the same conclusion — no detectable aggregate effect — comes independently from Yale, the Federal Reserve and the NBER, who have no stake in the matter. The convergence is not an industrial artifact; you have to judge on the methods, not the logos. The one point everyone converges on, adversaries included, deserves keeping: if there is an effect, it works through slower hiring, not through layoffs. That is not the same thing. You do not see it in the unemployment statistics; you see it in the difficulty of getting in.
1999, or not
That leaves the question of money, and here the comparison with the telecom bubble is both irresistible and badly made. The first problem is that nobody measures the same thing. Apollo puts hyperscaler capex at 2% of U.S. GDP in 2026 — that is 2.4 times the telecom peak of 2000; the Bank for International Settlements, for its part, writes that AI-related investment is worth « about 1% of U.S. GDP », that it is « not particularly large by historical standards », and that it represents « half » the rise in IT investment of the dot-com bubble. A factor of two between two serious sources. This is not a factual disagreement: it is a definitional artifact. Apollo relates the global capex of five firms to U.S. GDP; the BIS uses national accounts. Any claim of the form « AI capex is worth X% of GDP » is uninterpretable without specifying which of the two measures is used.
The best-built comparison is elsewhere, and it comes from the St. Louis Fed: same method, same categories, two eras. Investment in computers and software made up 39% of U.S. GDP growth over the first three quarters of 2025, against 28% in 2000. It is the only figure in the file that is truly comparable term for term — and it says that yes, AI weighs more heavily today than the internet bubble at its peak.
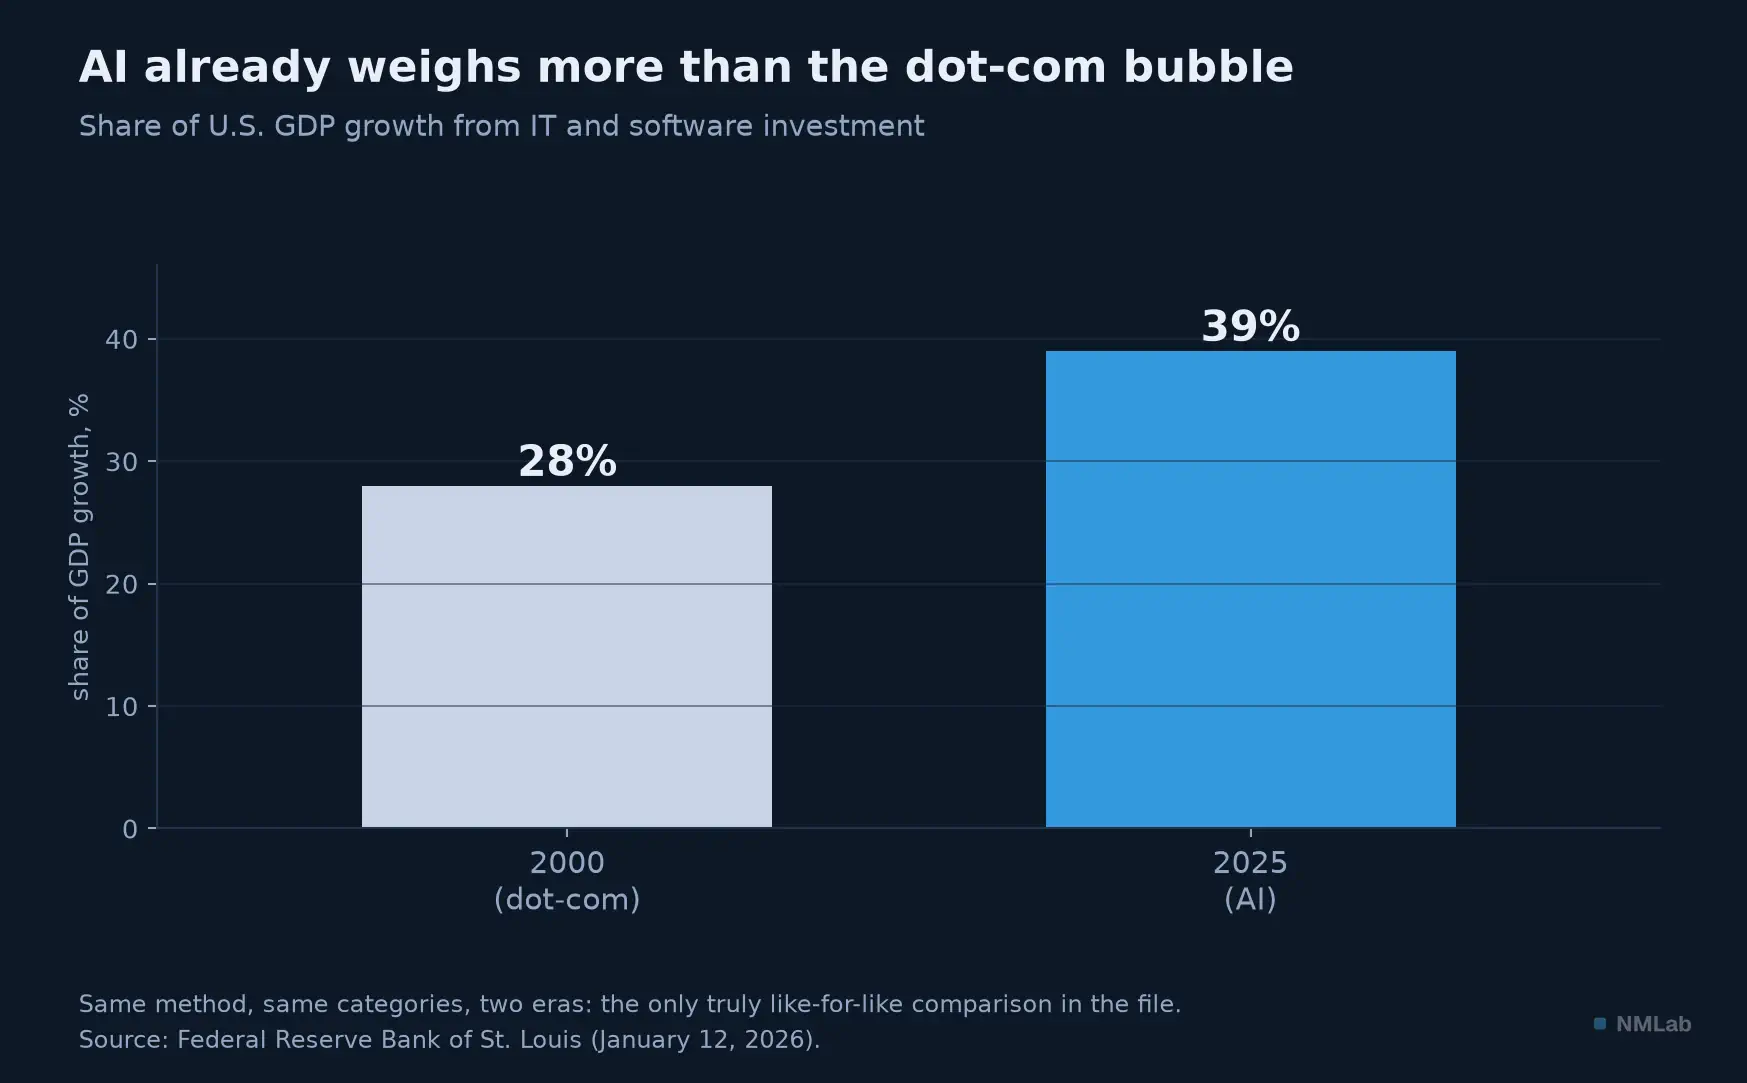
The best-built comparison in the file: same method, two eras.
As for the « dark fiber » analogy, it is in trouble. At the end of 2002, only 10% of the long-haul fiber laid in Europe and North America was carrying a signal — and only 10% of the wavelengths were lit, i.e. about 1% of capacity in use. In 2026, the vacancy rate of Northern Virginia data centers is 0.3%, and in Dallas capacity under construction is pre-leased at 88%: you do not build into the void, you build to order. But the analogy turns around in a way its critics did not see. Fiber was a passive asset of twenty to thirty years: it could wait for demand without degrading — and indeed, it was eventually lit. The graphics processor, by contrast, depreciates in three to five years; if it is not used, it does not become cheaper, it becomes obsolete. AI does not have the option to wait that fiber had. The real parallel is therefore perhaps not physical overcapacity, but the myth of demand: in 1997, a WorldCom press release launches the idea that internet traffic doubles every three months, when in reality it was growing 80 to 100% a year — Andrew Odlyzko, of AT&T Labs, had proved it as early as 1998. No one wanted to hear it; two trillion dollars of valuation vanished.
What the investor should watch
Three signals, and they are dated. The first is the June 2026 crossing, with which this chapter began: aggregate hyperscaler capex now exceeds their operating cash flow. Look at the accounts. The order book explodes: Microsoft's commitments doubled in a year, Oracle's multiplied by 4.6. Cash, for its part, tightens: Oracle posts negative free cash flow of $23.7 billion, Amazon a flow collapsed to $1.2 billion over twelve months. More promised, less collected. The second is circularity: two of the three big net-income results published in the first quarter of 2026 are inflated by capital gains on cross-holdings in AI — $36.9 billion at Google, $16.8 billion at Amazon for its stake in Anthropic. In other words, part of the reported profits comes from the valuation of firms they finance themselves.
The third is credit, and it is the BIS that puts it best. Private loans to AI firms went from almost nothing to more than $200 billion; their share of private credit outstanding, from less than 1% to nearly 8%. Yet the spreads demanded on these loans — 6.2 points, against 6.1 for the others — are nearly identical: lenders therefore judge AI risk perfectly average. The BIS draws the conclusion that should keep you awake: « either lenders are underestimating the risks of AI investments, or equity markets are overestimating the future cash flows AI might generate. »
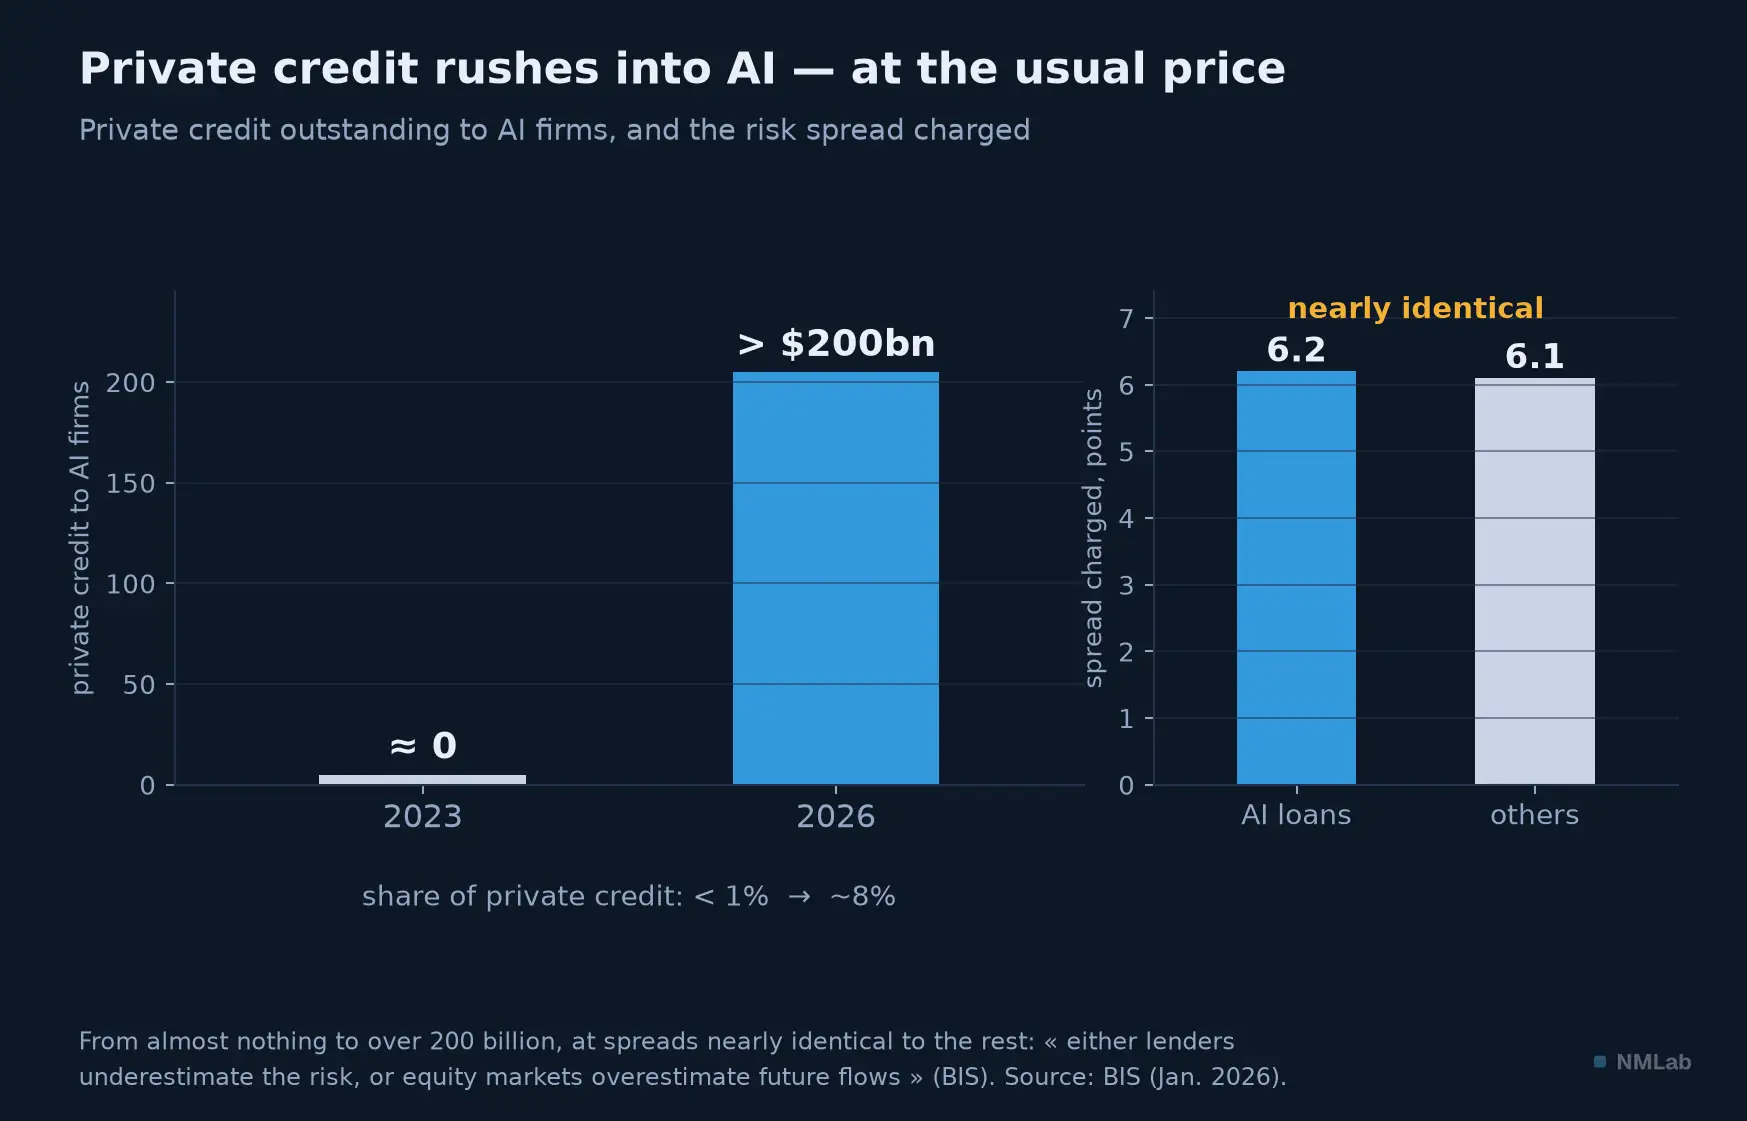
Credit rushes into AI without demanding the slightest extra risk premium — the signal the BIS judges the most worrying in the file.
One agency, at least, no longer judges that risk average: on July 9, 2026, S&P downgraded Oracle to BBB−, one notch above speculative grade, naming its dependence on a single client — OpenAI, about half its order book — as a « major credit risk ». And the BIS recalls that the end of previous investment booms cost on average more than a point of growth — and that « the sharpest contraction followed the internet bubble, even though that boom was small relative to GDP. » Note the paradox: the size of the boom tells you nothing about the size of the wreckage.
Key takeaways
- The solid fact — U.S. labor productivity runs at 2.43%/yr since 2022, against 1.05% average over 2011-2019. Total factor productivity doubled. The acceleration is real and measured.
- But dating is not attributing — When it starts, fewer than 10% of large firms planned to use AI; two years later, adoption tops out at 12%. The most solid explanation remains post-pandemic reallocation.
- The micro gains are real all the same — Randomized trials: −40% writing time (Noy-Zhang), +14% issues resolved per hour and +34% for novices (Brynjolfsson-Li-Raymond), +12% tasks and 56% faster for developers. But three steps separate a task from an economy: the weight of the task, adoption (12%), and the conversion of saved time into output. The product lands on Acemoglu's order of magnitude.
- Employment: the story doesn't hold — 101,743 cuts « attributed to AI » in H1 2026, about 1% of the 1.7 million real monthly layoffs. These are announcements, with the reason declared by the employer. The total falls 40% while the AI share quintuples: it is a shift of narrative, not of volume.
- No study establishes causality — Stanford (16% relative, but 6% raw) admits other factors may play; Yale sees nothing but declares itself underpowered; the Fed and the NBER find no aggregate effect. Convergence on the mechanism: if there is an effect, it works through slower hiring, not layoffs.
- 1999? Not exactly — AI capex is worth 1% or 2% of GDP depending on the definition (uninterpretable without specifying). The clean comparison: IT makes up 39% of growth in 2025 versus 28% in 2000. « Dark fiber » does not fit (0.3% vacancy) — but the GPU depreciates in 3-5 years, fiber waited thirty.
- What changed in 2026 — Hyperscaler capex exceeds cash flow. Oracle: negative free cash flow of $23.7 bn, downgraded to BBB− on July 9. Private credit to AI went from ~0 to more than $200 bn at spreads identical to the rest: « either lenders are underestimating the risk, or equity markets are overestimating future cash flows ».
The journey ahead
You now know everything one can honestly say about AI and growth — which is to say far less than what you are told. That leaves the other engine, the one that depends on no technology and whose future is already written in the civil registers: the number of hands. Can an economy that loses its workers grow? Japan answered that question for thirty years, and the answer surprised everyone. Next chapter: « Demography and Growth: How Population Shapes the Economy ». Until then, an exercise: the next time a headline announces thousands of jobs cut « because of AI », look up who said it. In almost every case, it is the employer — and no one checked.
Sources and references
- Epoch AI, analysis of June 5, 2026 — the crossing between aggregate hyperscaler capex and operating cash flow in the third quarter of 2026.
- Bureau of Labor Statistics — labor productivity of the nonfarm business sector (OPHNFB) and total factor productivity (MFPNFBS); Employment Situation and Job Openings and Labor Turnover Survey for June 2026 (1.7 million monthly layoffs, a 1.1% rate).
- U.S. Census Bureau, Business Trends and Outlook Survey — fewer than 10% of large firms planning to use AI in the fourth quarter of 2023, 12% in the third quarter of 2025.
- Eurostat, Use of artificial intelligence in enterprises, "ICT usage and e-commerce in enterprises" survey (2025 wave, 157,000 enterprises surveyed) — 19.95% of EU enterprises with ten or more employees use at least one AI technology, 55.03% of large enterprises, after 13.5% overall a year earlier (+6.47 points). ⚠️ A broader definition than the U.S. BTOS: the two rates are not comparable term for term.
- Challenger, Gray & Christmas, monthly reports of June 2026 and December 2025 — 443,604 announcements in H1 2026 of which 101,743 « cited » as AI-related; 1,206,374 in 2025 of which 54,836 for AI and 293,753 for federal cuts; the « technological update (possibly AI) » category.
- Daron Acemoglu, “The Simple Macroeconomics of AI”, NBER Working Paper 32487, May 2024; published in Economic Policy 40(121), 2025 — the ex ante, task-by-task estimate of AI's macroeconomic gains: under 1% of cumulative TFP over ten years.
- Shakked Noy & Whitney Zhang, « Experimental evidence on the productivity effects of generative artificial intelligence », Science 381, July 2023 — writing tasks: −40% time, +18% quality.
- Erik Brynjolfsson, Danielle Li & Lindsey R. Raymond, « Generative AI at Work », NBER Working Paper 31161, 2023; Quarterly Journal of Economics, 2025 — customer support: +14% issues resolved per hour, +34% for the least experienced.
- Fabrizio Dell'Acqua et al., « Navigating the Jagged Technological Frontier », Harvard Business School Working Paper 24-013, 2023 — BCG consultants: +12% tasks, 25% faster, +40% quality; but degraded performance outside the frontier of the model's capabilities.
- Sida Peng, Eirini Kalliamvakou, Peter Cihon & Mert Demirer, « The Impact of AI on Developer Productivity: Evidence from GitHub Copilot », 2023 — task completed 55.8% faster.
- Erik Brynjolfsson, Bharat Chandar & Ruyu Chen, « Canaries in the Coal Mine? Six Facts about the Recent Employment Effects of Artificial Intelligence », Stanford Digital Economy Lab, revised November 13, 2025 — the 16% relative decline (6% raw) and the admission that other factors may explain it.
- Zanna Iscenko & Fabien Curto Millet, « Looking for the Ladder: Is AI Impacting Entry-Level Jobs? », Economic Innovation Group, January 2026 — the March-April 2022 postings peak, the 38% of exposed workers in rate-sensitive sectors, and the −25% cohort artifact under a mere hiring freeze. Both authors are economists at Google.
- Martha Gimbel, Joshua Kendall & Ryan Nunn, « What We Do and Don't Know About How AI Is Affecting the Labor Market », Yale Budget Lab, May 7, 2026 — no visible impact, and the statistical-power limit acknowledged by the authors.
- Maxim Massenkoff & Peter McCrory, « Labor market impacts of AI: A new measure and early evidence », Anthropic, March 5, 2026 — no rise in unemployment, hiring slowdown « barely significant ».
- Jessica Liu & Douglas Webber, « AI Adoption and Firms' Job-Posting Behavior », FEDS Notes, Federal Reserve, March 27, 2026; Baslandze et al., NBER Working Paper 34984, March 2026 (~750 executives); Michael S. Barr, Federal Reserve governor, speech of July 14, 2026 — « little evidence of economy-wide job displacement from AI ».
- Iñaki Aldasoro, Sebastian Doerr & Daniel Rees, « Financing the AI boom: from cash flows to debt », BIS Bulletin No. 120, January 7, 2026 — AI investment at ~1% of GDP, « half as large as the dot-com boom », private credit from 0 to more than $200 billion at identical spreads, and the « lenders underestimating / equity markets overestimating » alternative; BIS, Annual Economic Report 2026, chapter I, June 28, 2026, on technology booms that end in recession.
- Hannah Rubinton & Bontu Ankit Patro, « Tracking AI's Contribution to GDP Growth », Federal Reserve Bank of St. Louis, January 12, 2026 — the 39% of growth in 2025 versus 28% in 2000.
- Torsten Slok, Rajvi Shah & Shruti Galwankar, « Putting the total amount of hyperscaler capex into perspective », Apollo Global Management, February 2026 — hyperscaler capex at ~2% of U.S. GDP.
- Jeff Hecht, « Boom, Bubble, Bust: The Fiber Optic Mania », Optics & Photonics News, October 2016 — the TeleGeography estimate of end-2002 (10% of fiber lit, 10% of wavelengths) and the demand myth born of a 1997 WorldCom press release, debunked by Andrew Odlyzko as early as 1998.
- CBRE, Global Data Center Trends 2026, June 17, 2026 — 0.3% vacancy in Northern Virginia, 88% pre-leasing in Dallas.
- S&P Global Ratings, downgrade of Oracle to BBB−, July 9, 2026; quarterly accounts of Microsoft, Alphabet, Amazon and Oracle (February-April 2026).
- Figure data: BLS via FRED (OPHNFB, MFPNFBS), Challenger, JOLTS, U.S. Census Bureau (BTOS), BIS, St. Louis Fed — vintage of July 15, 2026.